Esri partners are engaging major businesses and communities in remarkable ways, increasing efficiencies and giving more people access to geospatial information.
Find out how five Esri partners have used a range of ArcGIS solutions to help big businesses, local governments, city departments, and utilities do in-depth analysis, perform damage assessments, gain situational awareness, and implement enterprise-wide GIS solutions.
Not only do they work with The Science of Where, but they extend it as well.
Amazon HQ2: Seeing Beyond the Statistics
In September 2017, Amazon put out a call for bids to find a location for a new corporate headquarters, Amazon HQ2. The Metropolitan Washington Council of Governments (MWCOG) was keen to respond on behalf of its member jurisdictions, which include the District of Columbia and communities in Maryland and Virginia.
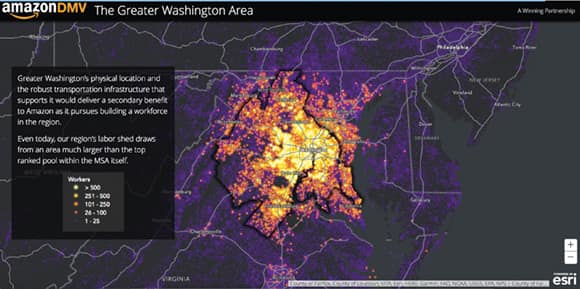
Known by many as the DMV (DC-Maryland-Virginia), the region is home to more than 5 million people and has one of the strongest economies in the United States. The DMV’s workforce is highly educated, diverse, and oriented toward business and technology. There is a dependable housing market and easy access to multimodal regional transit and cultural amenities. These are all attractive qualities for Amazon HQ2.
To ensure that the DMV was a key player in the bid, MWCOG contacted Datastory Consulting, which, in early 2017, had helped keep Marriott International’s corporate headquarters in Montgomery County, Maryland.
Datastory first developed analytics that compared the DMV to other metro areas. It then deployed these insights to MapDash, a business dashboard that leverages ArcGIS Online and Esri’s vast collection of demographic data to help users organize and analyze data. From this, Datastory created an Esri Story Maps app that highlights the region’s strengths in terms of demographics, the workforce, transit access, housing, and quality of life.
The story map enabled Amazon to see beyond the statistics and experience the data through interactive, colorful maps and photos of neighborhoods that exhibited workforce information, transportation routes, and housing trends and also showcased the region’s commitment to sustainability. It let MWCOG tell an engaging story that conveyed how robust the DMV would be as Amazon’s new home.
The result? Out of the 238 cities that submitted bids, Amazon announced that 3 of the 20 finalists were in the Greater Washington area.
Discovering What’s Left with Before-and-After Imagery
In December 2017, Southern California was engulfed in multiple wildfires. The Thomas Fire was the most destructive, destroying more than 1,300 structures over 440 square miles in Ventura and Santa Barbara Counties. To date, it is the second-largest wildfire in state history.
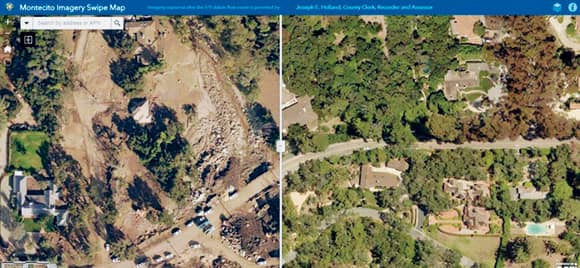
Following the Thomas Fire, a catastrophic mudslide in January left roads and properties inaccessible in southern Santa Barbara County. Officials couldn’t travel around to assess the damage, and evacuated property owners were unsure of what they would come home to, if anything. So the county turned to EagleView Technologies and its Pictometry imagery.
While the Santa Barbara County Planning and Development department mapped debris flow layers in ArcGIS Desktop, EagleView captured Pictometry imagery for the assessor’s office. Once available, the imagery became the basemap for parcel layers built in ArcGIS—a critical view given the number of parcels that were unidentifiable.
EagleView then used Web AppBuilder for ArcGIS to make Pictometry imagery from 2015 and 2018 available to county residents, enabling them to see the condition of their properties.
“We wanted constituents to…be prepared for what they’d face once they were able to access their properties,” said Aimee Strub, the information systems manager for Santa Barbara County’s Clerk, Recorder, Assessor and Elections Office.
In addition to providing home and business owners with high-resolution views of their properties, the powerful combination of Pictometry imagery and ArcGIS technology gave county public safety agencies before-and-after perspectives of areas they couldn’t access. Santa Barbara County was also able to assess property damage in half the time it usually takes, which expedited residents’ tax refunds.
“Uploading the orthoimagery into ArcGIS was such a simple process with Web AppBuilder, and the oblique imagery proved to be invaluable for our appraisers,” added Strub.
Street-Level Imagery Changes the Game in NYC
Just as the New York Yankees up their game each summer for a shot at the world series, the City of New York is playing a new game with GIS and street-level imagery. This game is transforming city operations and keeping public safety personnel and citizens safer.
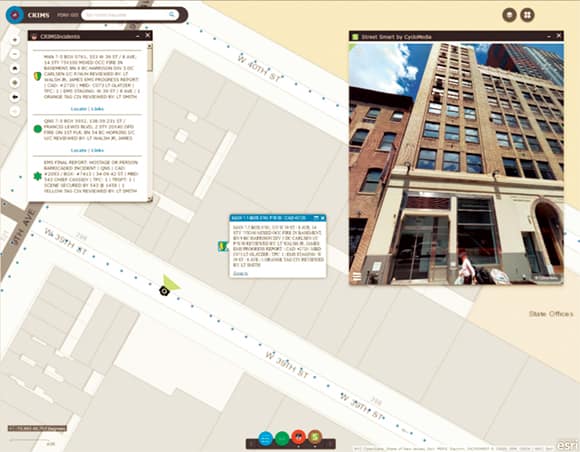
The New York City Fire Department (FDNY) has more than 11,000 firefighters and fire officers and 4,200 emergency medical personnel. Combined, they respond to more than 1.7 million calls annually. FDNY has created innovative, interactive GIS tools for fire and emergency medical services operations using street-level imagery from CycloMedia along with Web AppBuilder for ArcGIS. These tools help plan response and operational procedures, as well as support incident maps with dispatch integration and a ground-level image view of incident locations. FDNY collects and displays critical information for incident locations with GIS and extracts asset data from the street-level imagery, creating more accurate situational awareness for responders and incident commanders.
“Web AppBuilder has really revolutionized the way we’re building and presenting maps,” said Captain Mike Brady, the commanding officer of FDNY’s GIS unit, in his presentation at the Public Safety Summit at the 2018 Esri User Conference.
The imagery was initially adopted by New York City’s Department of Finance—one of the many GIS players in the city—which experienced a dramatic transformation in its daily workflows. In the first year alone, the department did more property assessments while greatly reducing field visits. This drove a significant increase in direct revenue for the city.
Adopting CycloMedia’s street-level imagery has been so successful, the city now captures imagery of New York twice a year. A real game changer, right?
Joining Three Utilities on Five Islands Under One GIS
The Hawaiian Electric Company consists of Hawaiian Electric on the island of O’ahu; Hawai’i Electric Light on the big island of Hawai’i; and Maui Electric, which serves Maui, Molokai, and Lanai.

To support more coordinated grid management, the Hawaiian Electric Company wanted to move each utility from its own GIS to a company-wide enterprise GIS implementation. In July 2015, the company began working with UDC to design the system, which would incorporate ArcGIS software and ArcFM from Schneider Electric, a solution that helps utilities better track and maintain their assets.
One major focus of the project was building a common business approach for how to represent assets and then determining how those assets would be managed going forward. A significant challenge was migrating all the data from each of the utilities and moving it to the new enterprise architecture. UDC designed a data governance and organization strategy that the Hawaiian Electric Company implemented to facilitate the enterprise GIS arrangement and maintenance.
To build this system of record and engagement, each electric company worked with UDC to deploy both ArcGIS Desktop and ArcGIS Enterprise. UDC also configured and deployed Schneider ArcFM in conjunction with its custom-built quality assurance and quality control tools to monitor and manage the data migration. Additionally, UDC’s integration team assisted the electric companies with incorporating a number of apps, including the Oracle Utilities Network Management System, which helps manage outages.
Once the enterprise GIS project was completed, the Hawaiian Electric Company was able to leverage its already existing investments in Oracle and other apps across the enterprise. This single system implementation has allowed the utilities to standardize and streamline business processes, improve cross-training of team members, and reduce operating costs.
A Progressive Utility Maintains Its Enterprising Essence
When the City of Independence, Missouri, fired up its first power plant in 1901, electrical power was considered cutting-edge technology. More than 115 years later, Independence Power & Light (IPL) is still a progressive electric utility, as evidenced by its investment in Cityworks, a GIS-centric asset management system from Azteca Systems, LLC, that replaced IPL’s homegrown work and asset management program.
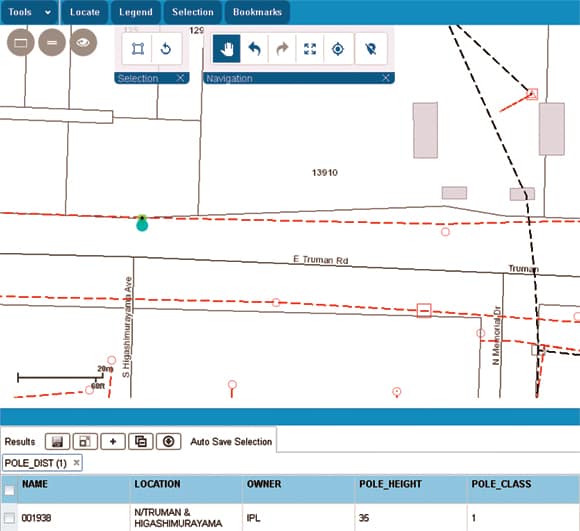
The utility chose Cityworks to address its primary challenges: integrating the diverse software landscape that supports putting together design templates, reserving materials for future projects, and dealing with workflow data and scheduling. Though the existing management system was working, it was being far outpaced by more efficient technologies.
Because IPL needed to bridge several technology gaps to develop a successful solution, it chose to partner with POWER Engineers, which specializes in formulating cohesive engineering solutions.
POWER Engineers seamlessly integrated an inflexible financial asset program from JD Edwards that runs on IBM’s AS/400 mainframe server with Cityworks. The company then brought in the Automated Utility Design (AUD) development team from Spatial Business Systems to enable the two systems to effortlessly share data.
Now IPL can create new designs in its AUD software, link it to a Cityworks work order, create a list of materials and the quantities needed (including estimates for labor and construction design drawings), and load these into the work order for construction crews. The tasks generated in Cityworks then trigger calls to the JD Edwards financial asset program to retrieve the actual materials and labor hours and populate the Cityworks work order. This allows IPL staff to compare estimates with actual costs to budget more accurately.
In the first five months following the deployment of this new system, IPL staff created more than 5,700 work orders that correctly captured all work activity on field assets.
“The ability to provide the true history of an asset through its life cycle is a first for our utility and will offer a wealth of benefits in future planning,” said Janna Weir, IPL’s systems program supervisor.
For IPL’s customers, this means that their rates stay stable, they get more comprehensive customer service, and IPL responds faster to outages. The data gathered and shared through Cityworks allows IPL to ensure that aging infrastructure remains reliable. The company can also stay ahead of the curves of growth and demand for electrical power, develop better business plans for capital projects, and reduce waste by doing paperless communication and documentation for projects.
From aiding with new subdivision builds to making monthly billing more efficient, IPL’s new ArcGIS software-enabled asset management system makes Independence a better place to live.

