Federal Agencies Use Sonar, Lidar, Optical Imagery to Preserve Seafloor Habitats
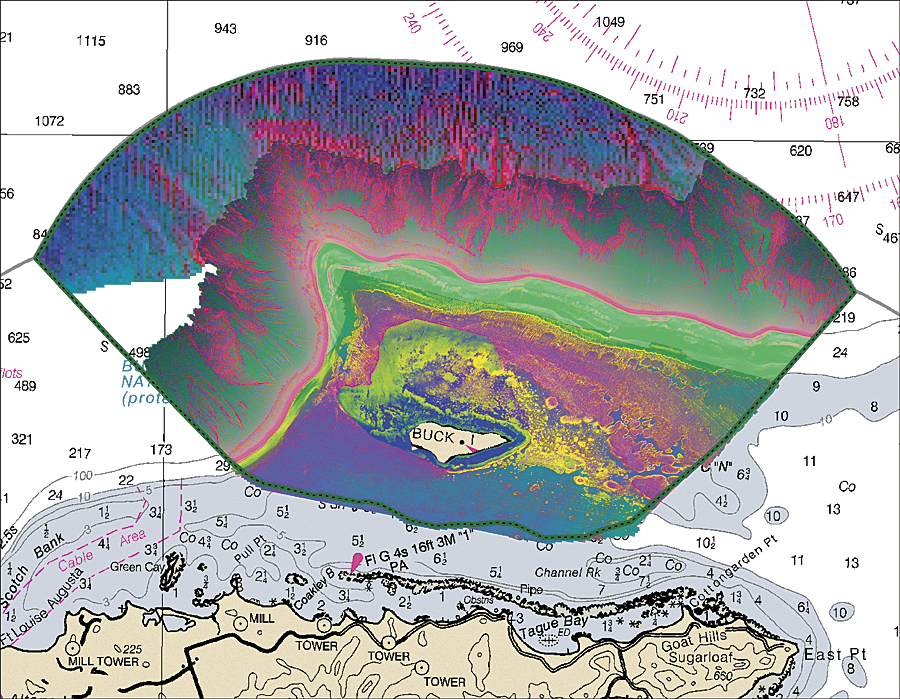
Buck Island Reef National Monument, off the US Virgin Island of St. Croix, is one of only a few fully protected marine areas overseen by the US National Park Service (NPS) and is home to a coral reef ecosystem that supports a large variety of native flora and fauna, including several endangered and threatened species, such as hawksbill turtles and brown pelicans. This area has been dubbed one of the finest marine gardens in the Caribbean Sea. Still, the monument is relentlessly impacted by its visitors, boaters, snorkelers, and scuba divers, as well as pollution, climate change, and extreme weather events like hurricanes.

Recently, the US National Oceanic and Atmospheric Administration (NOAA) has assisted NPS to map and extract detailed information about the monument’s seafloor habitats. To do this efficiently, NOAA needed to develop a new semiautomated approach that would allow it to process, analyze, and fuse different types of imagery and provide NPS with the fundamental data needed to make informed decisions.
When One Sensor Isn’t Enough
After evaluating the area, NOAA determined that traditional marine mapping methods that rely on the manual interpretation of optical imagery derived from satellites couldn’t produce a comprehensive habitat map of the monument given its depths, which extend from the coastline of Buck Island to 1,800 meters at its deepest extent.
“We had a very unique problem,” says Tim Battista, an oceanographer at NOAA. “There is no one technology or sensor that allowed us to collect the data we needed in the range of depths present at the monument. We had to devise a method that would allow us to both measure seafloor depths, as well as characterize its habitats, across the entire seascape in the monument.”
After much testing and innovation, NOAA ultimately devised a new method that fuses four different sonar, lidar, and optical imagery sensors to gather the information needed. NOAA chose to use Esri’s ArcGIS with ENVI image analysis software from Esri Platinum Partner Exelis Visual Information Solutions of Boulder, Colorado, to tackle this unique challenge. This combination allows the processing and image analysis of the latest image types, such as radar, lidar, optical, hyperspectral, stereo, thermal, and acoustic. Using GIS and image analysis software, the strengths of these different sensors can be exploited together, which creates a rich context that aids in decision making.
NOAA recorded depth and other characteristics of shallow areas in the monument using multispectral and lidar imagery. This imagery was acquired from planes that flew over the areas needing mapping. Multispectral and lidar mapping can be used for water up to about 30 meters in depth, the point at which light is often unable to penetrate to the seafloor.

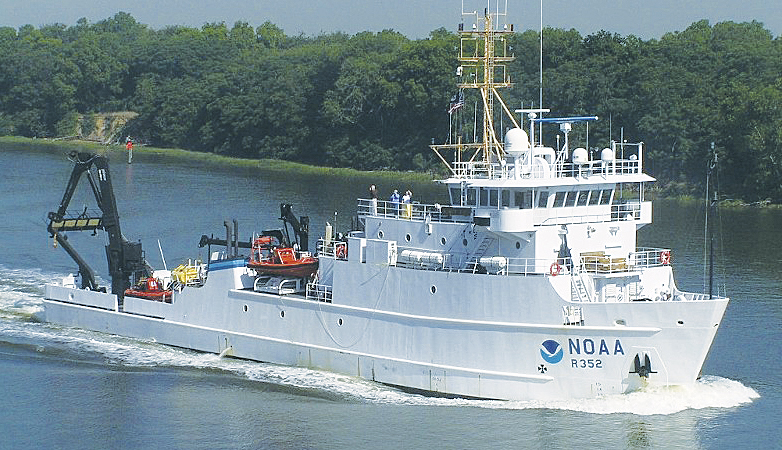
At depths of more than 5 meters, NOAA used sonar technology located on board vessels and ships, such as the NOAA ship Nancy Foster, to scan the seabed. The Nancy Foster emits more than 3,500 pings per second, and receivers on the ship record the time and angle of the echoes returning from the seafloor. Days spent sailing and employing sonar technology yielded bathymetry, or depth information. The intensity of the echo also provided information about the seafloor, such as how hard, soft, rough, or smooth it is, which often indicates discrete habitats, such as coral, sand, and sea grasses.
Mapping the Seafloor
The lidar and acoustically collected bathymetry were also used to calculate a suite of complexity metrics in ArcGIS, such as slope, which emphasize the differences between habitats on the seafloor. As part of its preprocessing work, NOAA used principal component analysis to reduce redundancy in the data and better understand the complexity on the seafloor. This, along with ancillary data, including intensity information, was loaded into ENVI, allowing the researchers to draw distinctions between softer and harder sediments in flatter areas of the seafloor.
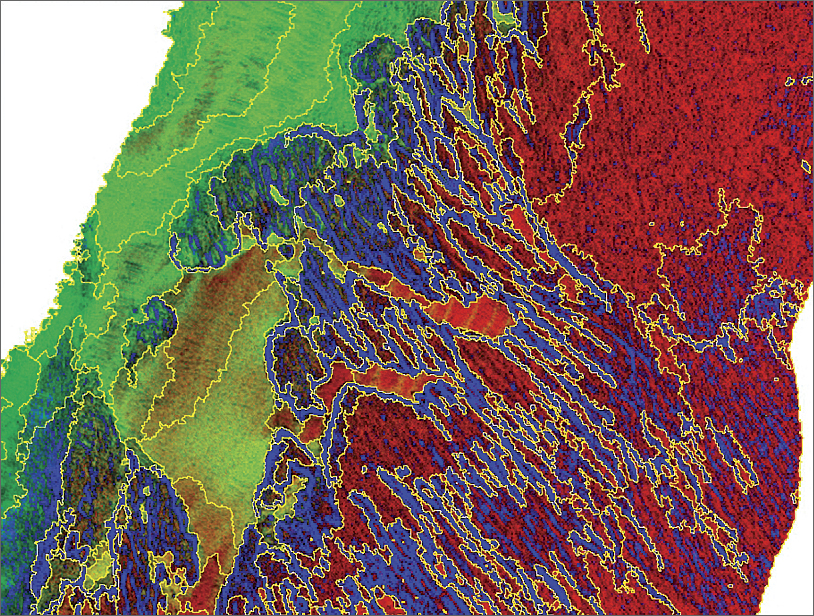
Using an automated workflow, NOAA staff segmented the imagery data using the software’s extraction tool. Following image segmentation, users classified and assigned attributes to the features in their imagery. NOAA staff classified features by selecting locations with unique acoustic or optical signatures and performed ground validation using still and video cameras operated by divers and remotely operated vehicles. NOAA’s classification scheme used to describe these sites takes into consideration what the seafloor is made out of, what is growing on top of it, and the quantity of cover.
NOAA then took the segments and classified ground validation points using a free add-on tool to ENVI called RuleGen. RuleGen includes a classification and regression tree that was well suited for NOAA’s acoustic datasets. Afterward, NOAA staff returned to the field and verified the accuracy of the output—a draft classified habitat map.

“Acoustic data is often very noisy and heterogeneous, which makes classification difficult using traditional pixel-based approaches,” says Sam Tormey, marine spatial analyst contracted with NOAA through scientific support provider CSS-Dynamac of Fairfax, Virginia. “We were able to overcome these challenges, so we are no longer classifying a pixel but, rather, an object. We are now able to more objectively and efficiently deal with heterogeneity and make products that meet our partners’ needs.”
Effective Analysis for Ecosystem Management Decisions
As a final step, NOAA took the habitat maps and other information derived from the imagery and moved them into ArcGIS for more analysis and the creation of applications. Information extracted from imagery and added to ArcGIS provided a complete picture of a geographic area of interest that includes pertinent, current information. Using ENVI for this step made the process to update ArcGIS with information from geospatial imagery seamless by delivering image analysis tools directly to both desktop and server environments.
Analysis included looking at the structure, biologic cover, and percent cover—key pieces of information that resource managers need to make effective ecosystem management decisions. One application that NOAA develops for some partners is a web-based mapping portal so that partners have the option of displaying each habitat class separately, overlaying ground-truth points, viewing videos and images that were captured, and creating custom maps. These portals are especially useful for partners that may not be familiar with GIS software.
Previously, NOAA staff could only monitor limited areas because the process was very time intensive and depended on the experiences and interpretation skills of the analyst, which aren’t highly replicable.
“Our past mapping efforts were conducted by manually digitizing and interpreting optical imagery,” says Tormey. “The new methods that were developed allow us to integrate the strengths of multiple acoustic sensors and multispectral and lidar imagery and produce a seamless product across the entire extent of our study areas.”
NOAA is now able to process, analyze, and fuse different types of geospatial imagery and integrate information to produce products at a much finer spatial scale, so maps are more reflective of the true features on the ground.
For more information, contact Bryan Costa, CSS, contracted to NOAA, or Patrick Collins, Exelis Visual Information Solutions. For more information on how GIS can help better analyze remotely sensed data and imagery, visit esri.com/imagery.

