ArcGIS Hub Site Aggregates Data on Waterways, Making It Easily Accessible to the Public
Agencies, organizations, and individuals collect hundreds of thousands of water samples from waterways across the United States each year. Every sample tells a story about the health of a waterway and its ability to handle stress from a variety of sources, including development, agriculture, contamination, drought, flooding, and changing seasons. When examined comprehensively, this data can provide a more accurate and complete foundation for making decisions that affect waterways and the wildlife, people, and industries that depend on them. Those decisions can be as simple as finding a good fishing hole or as complicated as determining how to preserve an entire ecosystem.
Too often, however, this data is fragmented, compartmentalized, or even kept completely out of reach. People and organizations house various datasets in diverse formats and in different physical and digital locations. This makes it difficult to manage waterways holistically.
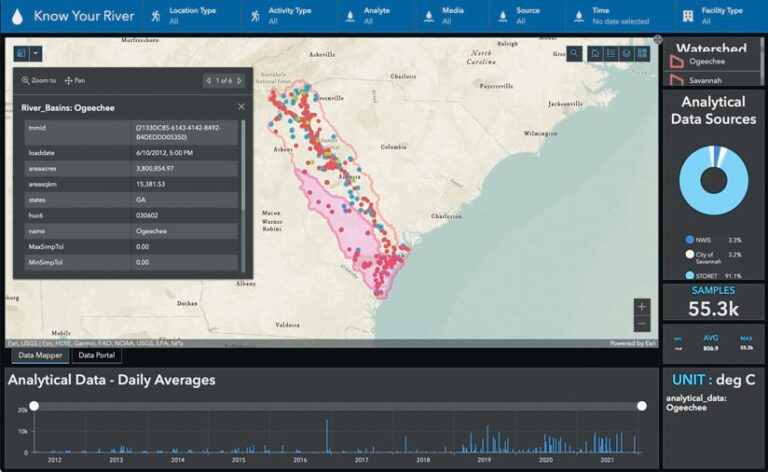
In the southeastern United States, the Savannah Riverkeeper and Ogeechee Riverkeeper organizations, along with the Phinizy Center for Water Sciences, are working with federal, state, and local governments and nonprofits to give the public better and easier access to data about the Savannah River and Ogeechee River basins. Using ArcGIS Hub as the basis of the solution, this cross-agency collaborative developed Know Your River, a powerful tool that collates data from more than 40 different sources into one interactive, geospatial interface. And although this particular solution is designed for a distinct geographic region, the team envisions that it can be scaled up or down to fit the needs of other waterways around the world.
Improving Public Access to Dispersed Data
The Savannah River and Ogeechee River basins span the Georgia-South Carolina state border, so river keepers in this area understand how difficult it can be to get cohesive data about these waterways from the various organizations and people who collect it. Even when projects are taxpayer funded, it can be an uphill battle to make useful information about the rivers available to the public. Data is often dispersed among governing agencies in different cities, counties, and states. Some data isn’t available in digital format at all, and a lot of it lacks spatial information. Typically, the only way people can retrieve data is by calling or emailing the data owner or, in some cases, filing a Freedom of Information Act (FOIA) request.
But data is only as good as it is accessible. That is why Savannah Riverkeeper and Ogeechee Riverkeeper have partnered with the City of Savannah and the City of Augusta and—with funding from the Georgia Environmental Protection Division (EPD)—are working to make the best science and knowledge about these waterways available to the most people. As Laura Walker, environmental administrator for the City of Savannah’s Water Resources Department, put it, “We [are] advancing the work of making siloed data accessible to everyone.”
The Know Your River hub site is organized around four themes: recreation, surface water, groundwater, and environmental justice. By toggling through the tabs of an ArcGIS StoryMaps story on the primary page of the hub, users can find out things like where to launch a boat along the Savannah River and adjoining lakes, which surface water bodies have recently had contaminants detected in them, information about groundwater levels at monitoring wells, and cancer risk statistics near Superfund sites. The hub also contains open datasets; a video tutorial for how to use the site; and a growing list of scientific studies on the Savannah and Ogeechee Rivers, complete with links to where they can be read.
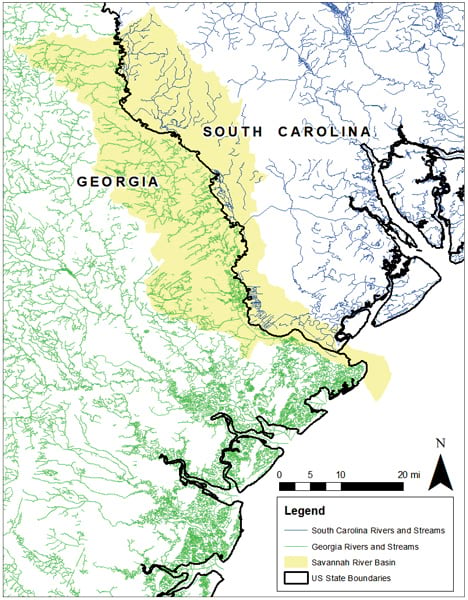
Aggregating Data So It’s Easy to Find and Use
When the team from Savannah Riverkeeper and Ogeechee Riverkeeper began this project, staff members had a giant spreadsheet that listed as many water quality data sources for the Savannah River and Ogeechee River basins as possible. To find a range of other useful data, they searched government websites, such as the South Carolina Department of Natural Resources, which posts the latitude and longitude of boat ramp locations. Team members also requested pertinent data directly from cities and nongovernmental organizations throughout the area.
Priority was placed on finding real-time data from water loggers—instruments maintained by the United States Geological Survey (USGS) that monitor water levels. The team also sought out web services that display water access locations, fishing advisories, flood zones, environmental justice statistics, and more from organizations such as the Water Quality Portal (a cooperative service sponsored by the USGS), the Environmental Protection Agency, the National Water Quality Monitoring Council, the Federal Emergency Management Agency, the South Carolina Department of Health and Environmental Control, and the EPD.
Now, the team has aggregated a range of data types and included them in online maps and apps that are easy to use and widely accessible. These data types consist of surface water features like rivers and ponds, public boat ramps, parks and campgrounds, infrastructure such as dams and power plants, fish consumption advisories, groundwater wells, real-time surface water levels, and real-time and forecasted rainfall. They also include water quality measurements that detect bacteria like E. coli, flood zones, potential sources of pollution, demographics related to environmental justice, and data collected by citizen scientists.
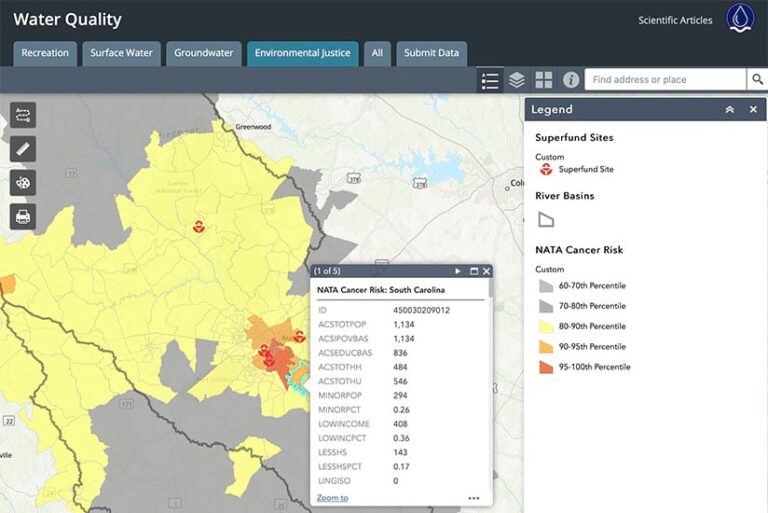
To bring all these data types into Know Your River in a way that makes them easy to employ and understand, the team used ArcGIS Online to create data layers that could be presented in web maps. ArcGIS StoryMaps and ArcGIS Dashboards display the data in visually appealing ways. ArcGIS Hub brings all this together in a user-friendly hub site. Additionally, the team used ArcGIS AppStudio to build an app that allows users to access data visualization and analysis tools on their mobile devices. The app can currently be downloaded via ArcGIS AppStudio Player and is expected to launch in app stores by June 2022.
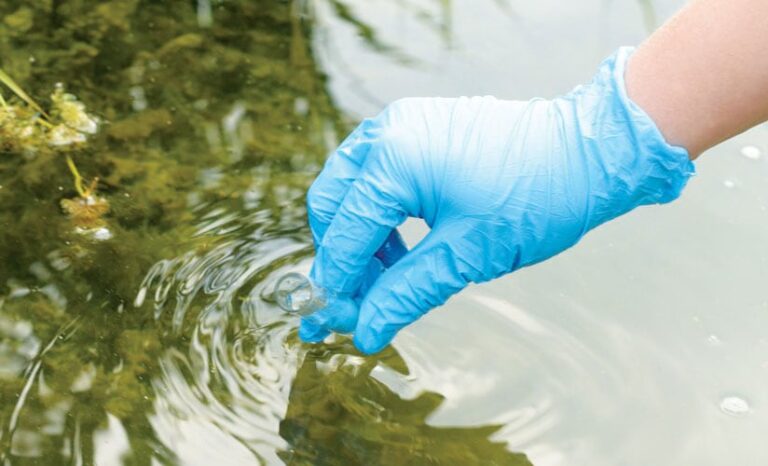
Staff members from Savannah Riverkeeper and Ogeechee Riverkeeper also regularly train Georgia Adopt-A-Stream-certified citizen scientists to collect water quality and visual inspection data from dozens of sample locations throughout the river basins. ArcGIS Survey123 allows these citizen scientists to submit their data, which the team then curates and incorporates into Know Your River if it is found to be sound data.
Making Upgrades and Planning for Expansion
Now that the hub site is up and running and data is easier to access in several visual formats, the Savannah Riverkeeper and Ogeechee Riverkeeper organizations have additional bandwidth to gather their own data. Staff members are currently launching their own water loggers to collect real-time data on temperature, dissolved oxygen, water levels, pH levels, and other important parameters for the two waterways. This data will be displayed in the maps available on the hub site.
The team is also continuing to improve Know Your River. Staff members are pulling similar data into uniform tables to improve data analysis capabilities and are building a dashboard that contains data analysis tools all in one place. The team would like to be able to offer users real-time text or email alerts when data they’re interested in is updated or added to the system. And the team is working on a new version of its Survey123 app-based water quality data collection app to improve its utility and combine it with Know Your River.
At its core, the Know Your River tool is a pilot project. Leaders at Savannah Riverkeeper and Ogeechee Riverkeeper would like to increase the number of users who engage with and employ the data available on the hub and would like the project to grow beyond the Savannah River and Ogeechee River basins. Ideally, people, organizations, and government agencies around the world will eventually be able to use the tool to access more cohesive data about the waterways that are important to them. In the spirit of data democratization, Know Your River is also available to be used as a template.
As Bruce Azevedo, chair of the Savannah-Upper Ogeechee Regional Water Planning Council, noted, “Informed decisions can only be made with the best available science and knowledge.”
