Even before the Inca empire ruled much of the western coast of South America, indigenous civilizations in and around the Andes mountains farmed familiar crops such as quinoa, chili peppers, and the all-important potato. Today, descendants of those societies continue to farm diverse and globally valued crops.
Yet recently, many of these communities have been unable to produce food like they did before—and the culprit is climate change. Farming communities that have survived for thousands of years are suddenly disappearing because of water scarcity.
To try and address this problem, the Andean Alliance for Sustainable Development (AASD) and the University of Louisville’s J.B. Speed School of Engineering used GIS to study what could be contributing to water scarcity in one Peruvian community. What they found—and the methodology they used—could help other societies in similar situations tackle their own climate-related challenges.
Advanced Technology Gets to the Root of the Problem
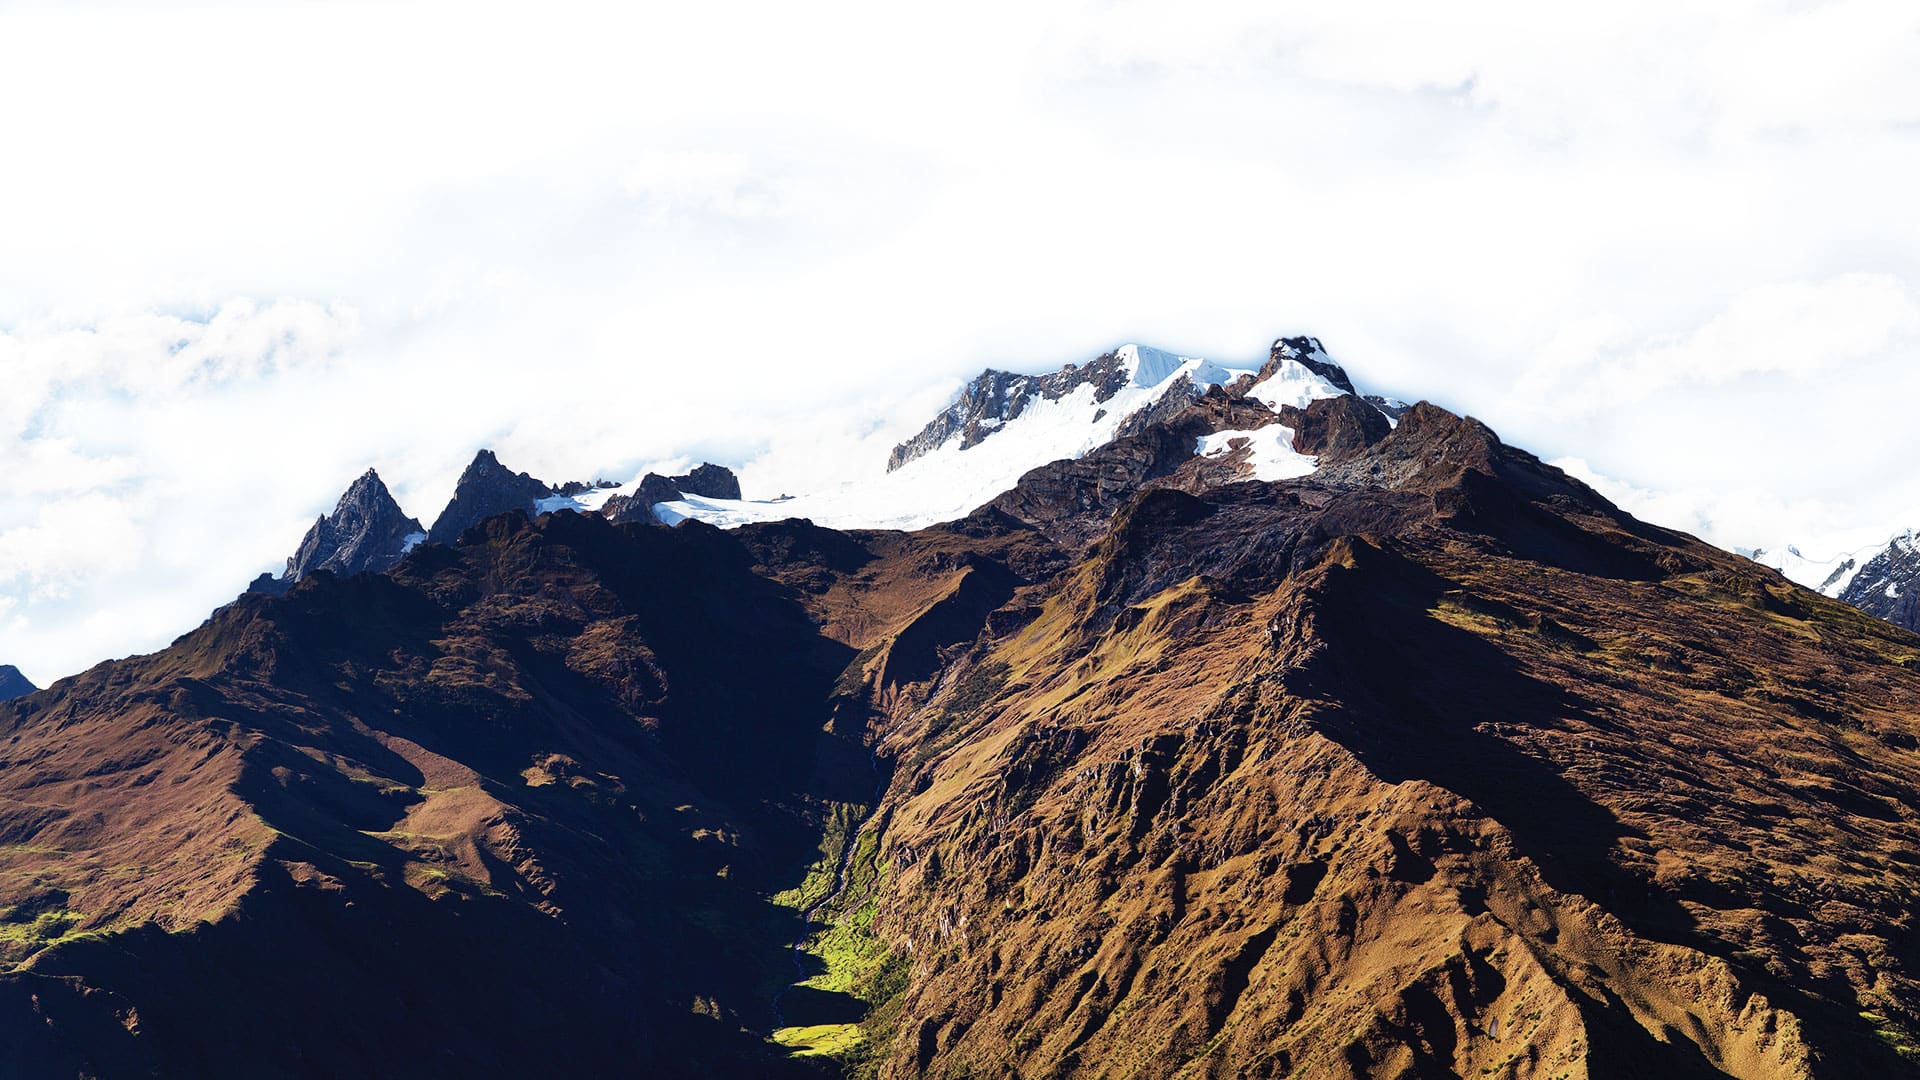
Sacclio is a small, indigenous farming community located in Peru’s Andes mountains, roughly 10,000 feet above sea level. Farmers in the area grow corn, but the community is struggling to provide them with enough water for their crops. The large stream that brings water in is dwindling while farmers’ demand for the vital resource is increasing. This is threatening not only their ability to produce distinctive varieties of Andean corn but also their indigenous way of life.

In 2017, AASD, a nonprofit agricultural organization in the highlands of Peru, partnered with the Speed School of Engineering on a multiyear project to figure out why Sacclio’s irrigation system is now insufficient. AASD had been using GIS technology since 2012 for various mapping projects. But when the Speed School of Engineering came onboard—launching the faculty-led International Service Learning Program (ISLP) Peru, wherein students apply their engineering skills in the field—the project got access to a host of new technology, including unmanned aerial vehicles (UAVs), Global Navigation Satellite System (GNSS) receivers, and water flow measurement tools.
To begin the joint effort in Sacclio, faculty from the university and staff from AASD used ArcGIS Pro to design the basemap that would depict the area of interest: the canal system that runs through the community. The team also used ArcGIS Pro to build the feature class templates that would be used in ArcGIS Collector to gather data.
In August 2018, a team of students from the Speed School of Engineering used Collector to map all 9 miles (14.4 kilometers) of Sacclio’s canal system. This created records of the various materials the canal is made of—including cement, rock, and earth—its hundreds of valves, and any major damage points. After that, faculty members and select students cleaned and processed the data and analyzed it in ArcGIS Pro. This content was then published to ArcGIS Online, which GIS staff members at AASD used to create shareable web maps for further analysis.

The extent of damage to the canal from natural causes such as rockfall, uprooting, and erosion turned out to be so extreme that a team from the Speed School of Engineering returned to Peru the following year to continue the project. Faculty members and students redesigned the survey to capture more details about damage locations and improve its feature accuracy. They also used mapping-grade GNSS receivers from Esri partner Bad Elf in conjunction with Collector to boost location precision.
For the first time, the team also used UAVs to capture high-resolution imagery of the Sacclio canal system, which substantially improved the resolution of the original basemap. Employing three Phantom 4 Pro quadcopters from DJI, project participants from the Speed School of Engineering and AASD collected thousands of aerial images over approximately 260 hectares of land. University faculty members then processed these images on-site using ArcGIS Drone2Map, which yielded two-inch pixel resolution. GIS staff from AASD then published the high-resolution imagery to the organization’s ArcGIS Online account so it could be used as a base layer for all web app products.

In addition, the engineering students used improved technology to measure water flow rates again. Employing a Mariotte bottle (which allows fluid to flow constantly from a container), a Sonde electrical conductivity meter, and EcoWatch Lite software, they measured water loss in the canal by injecting measurable amounts of salt at certain points and seeing how much of it was still in the water at collection points downstream. The students found that Sacclio’s canal system was losing up to 50 percent of its total water supply at the time the measurements were taken.
Data Visualizations Offer a Way Forward
With this more accurate data, hosted in its own ArcGIS Online environment, AASD was able to use ArcGIS Web AppBuilder and ArcGIS Configurable Apps templates to create two interactive web apps that make it easier to share critical information about Sacclio’s irrigation system.
Each app includes three major data points:
- The percentage of water lost, broken down by canal segment.
- Major damage points along the canal, described by type of damage, the severity, and their locations.
- Overall statistics about the canal, including its width, depth, number of valves, and build material at various locations.
But the two apps serve different purposes and are designed to give users distinct experiences.
The Sacclio Main Irrigation Canals Water Loss Locator, built with the Interactive Legend configurable app template, is data oriented. Users can select, search for, or layer information in various ways to view specific stories about the challenges the Sacclio irrigation system faces. Each data point in this app has a corresponding photo or video that brings users closer to what’s happening at various points along the canal.

The Main Irrigation Canals Damage Survey web app, built with the Attachment Viewer configurable app template, shows the depth and breadth of various damage points via photo-based storytelling. The map allows users to scroll through photos and videos of the entire canal and is an efficient and powerful way to communicate the severity of damage.
Having this quantitative data and spatial analysis available in two easy-to-use web apps makes it easier for the community of Sacclio to convey the gravity of its water scarcity issue to stakeholders who can do something about it.
For the past 10 years, the municipal government has consistently denied Sacclio’s request for funding to repair its irrigation system. Without any compelling evidence or data, the government body has often deemed the problem not serious enough to warrant investment. But now, with the ability to quickly and efficiently share specific, location-based data with municipal representatives, leaders in Sacclio are confident that the community has a compelling case to receive funding to restore its ailing canal.
A Replicable Model Based on GIS
In the Peruvian Andes, indigenous communities face unprecedented environmental challenges that stem from irrigation issues, climate change, and erratic weather patterns. That’s why AASD and the Speed School of Engineering plan to implement similar GIS-based programs in other nearby districts. Although GIS is underutilized in the area right now, the technology can be especially helpful to remote communities that need to document and communicate the issues they face. Thus, AASD remains committed to partnering with the University of Louisville—and perhaps other educational institutions—to use GIS to enact positive change in and around the Andes mountains.

What’s more, impact-driven collaborations like ISLP Peru can and should be replicated around the globe. There e countless communities like Sacclio facing grave challenges due to changing environmental and climatic conditions. Connecting institutes of higher education with community-based organizations and local leadership is an effective way to use GIS to address complex challenges. This is a replicable model for development and experiential learning, and AASD will continue to refine it in the years to come.
To learn more about this project, watch a video at youtu.be/wd6q-WXj7aA. For more information, email AASD director Adam Stieglitz at adam@alianzaandina.org or AASD GIS specialist Jim Valenza at jim.valenza@gmail.com.


