Tracking the Global Distribution of Trachoma
It feels like thorns scraping your eyes each time you blink.
Repeated infections during your childhood lead to scarring of the conjunctiva, or inner mucous membrane of the upper eyelid. Your eyelashes turn inward and scratch the cornea. Slowly, painfully, you may go totally blind.
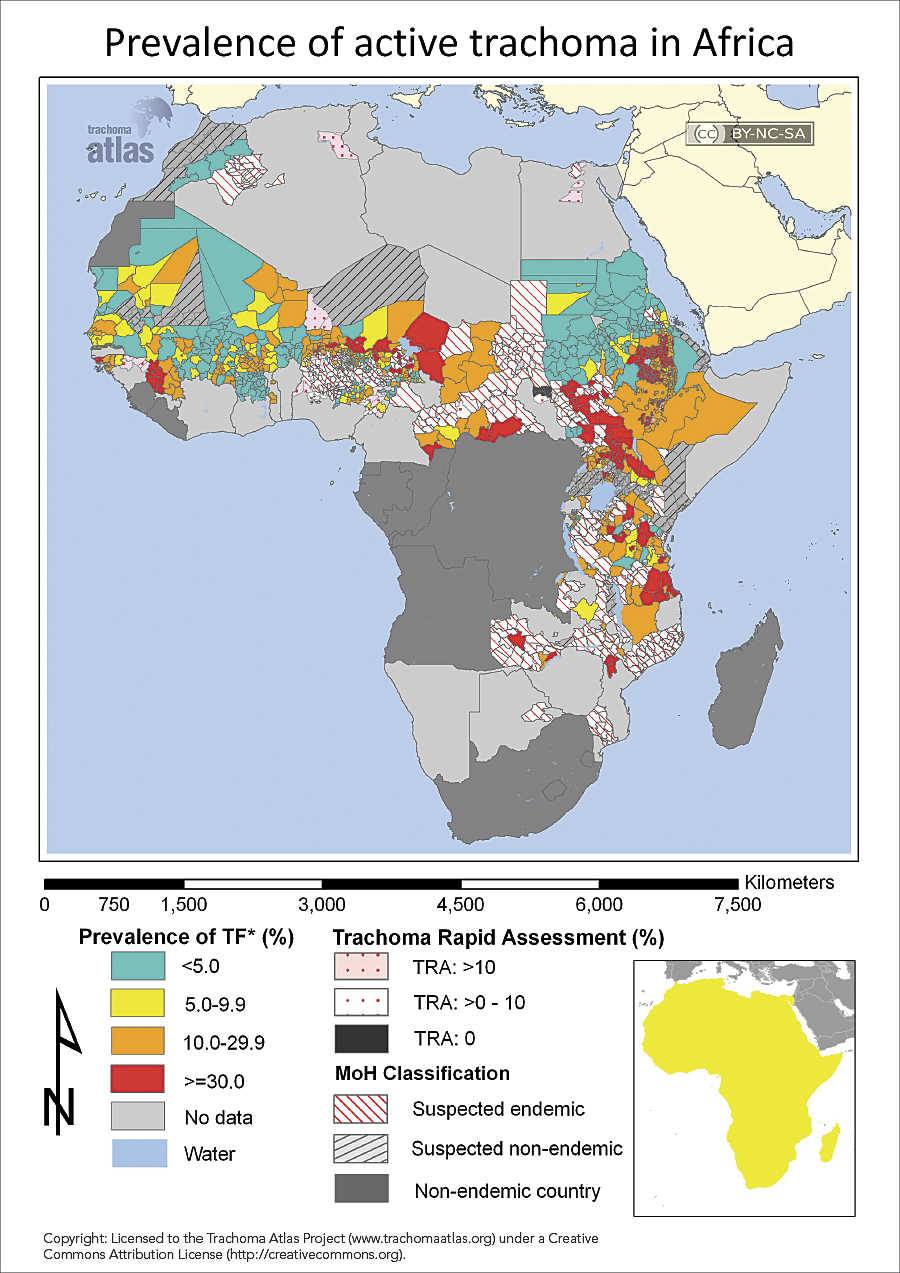
The affliction is called trachoma, and it affects mostly women and children among the poorest of the poor, especially in regions that have limited access to sanitation and water. There are more people suffering from trachoma in Africa than on any other continent. And because this bacterial disease is transmitted via close, personal contact, it tends to occur in clusters—often affecting entire families and communities.
Approximately 110 million people worldwide live in endemic areas and require treatment, with 210 million more living where trachoma is suspected of being endemic, according to International Trachoma Initiative (ITI) at Task Force for Global Health, based in Decatur, Georgia.

“Affected people are said to be living beyond the end of the road,” says Dr. Danny Haddad, director of ITI. “In some instances, you need to walk half a day to get to some of these villages.”
Neglected No Longer
Until recently, a better means to identify enclaves of a rogue’s gallery of so-called neglected tropical diseases—such as leprosy, river blindness, roundworms, elephantiasis, African sleeping sickness, and trachoma—has proved elusive.
Fortunately, according to Haddad, researchers combining smartphone and Esri technologies have figured out a quick way to visually assess the prevalence of trachoma in remote regions and pinpoint gaps in prevention and treatment services.
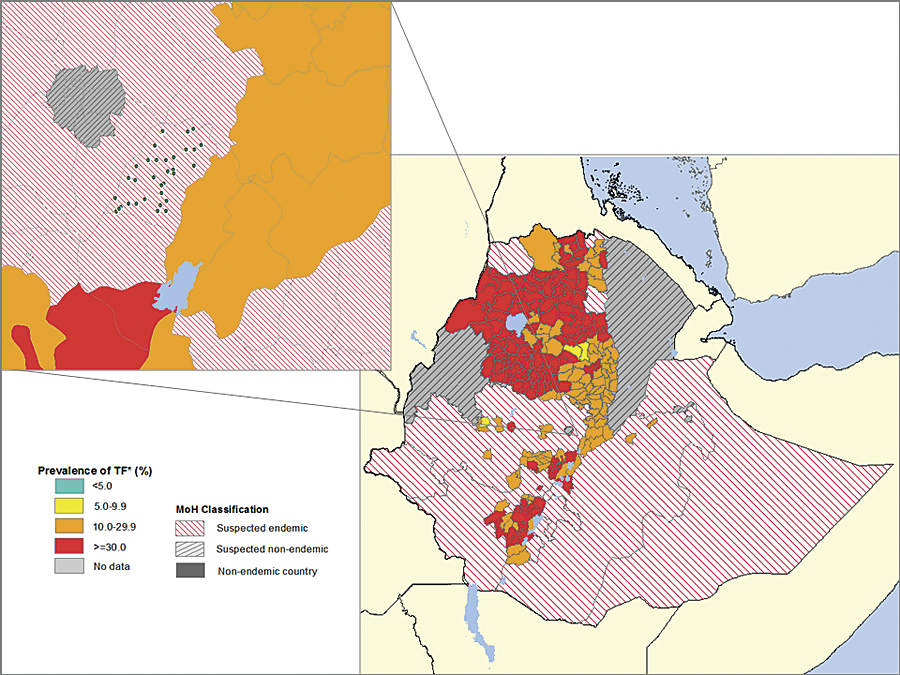
A trachoma developmental study of the latest data collection, transfer, and visual display process using ArcGIS began in mid-October 2012 in the Oromia region of Ethiopia. Several layers of smartphone and Esri technology enabled the immediate transfer of vast amounts of collected data to distant hardware and software platforms for data display, analysis, and sharing.
Esri software was chosen because of its dynamic capabilities, says epidemiologist Alex Pavluck, a senior manager of research information technology at ITI. Not only are GIS maps useful as visual tools, but they also offer real-time transfer of data and automated updates that provide much-needed efficiencies.
“One thing we wanted was the ability to produce layered maps,” Pavluck says. “These are really the key here to show prevalence overlaid with areas currently receiving treatments, such as donated drugs.”
The goal was to help realize an ambitious plan endorsed by World Health Organization (WHO)—a dream, if you will, of endemic countries with organized national trachoma control programs—called Global Elimination of Blinding Trachoma by 2020, or GET2020.
According to Haddad, the Esri technology-enhanced system was built on one already developed for a variety of neglected tropical diseases, including trachoma. It relied on Android devices, which made it easy for field-workers to use. A robust reporting back end allowed data to be sent via cellular network or Wi-Fi to a web-based system at Task Force’s headquarters. It didn’t take long for this approach to achieve surprising results—transmitting data from 18 countries on elephantiasis.

“Before we used the Android tools, we had piles of paper that had to be manually entered after a survey,” recalls Haddad. Initial success encouraged public health workers in endemic countries to realize that a system such as this—but even more capable—was needed to reach WHO’s ambitious GET2020 goal.
Global Atlas of Trachoma—developed in 2011 by ITI with the support of partners, such as the Bill & Melinda Gates Foundation, Carter Center, and London School of Hygiene & Tropical Medicine—provided up-to-date regional maps of trachoma’s geographic distribution. This tool allows health workers to reach more people with preventive hygiene, corrective surgery, and an antibiotic—azithromycin (Zithromax)—donated by pharmaceutical manufacturer Pfizer Inc.
Nevertheless, researchers discovered that the database supporting the atlas identified more than 1,200 health districts that still lacked the data needed to guide interventions. “We still didn’t have the entire picture,” says Rebecca Mann, geographic information systems data manager, ITI.
Heart of the System
The latest Esri software-enhanced system is designed to correct that. Here’s how it works: Trained field-workers initially collect data on smartphones and tablets using Android technology. “That’s the beauty of it,” says Mann. “The app can go on any device running Android.”
Then, the devices quickly transfer data to a website on a server housed at the Task Force in Decatur, where it is summarized, checked for errors, and mapped. Using a 3G connection, the data can be transmitted to the server in real time.
Next, the data moves to a central MySQL Server linked to an ArcGIS mapping server. Python script automatically converts tabular data into feature points that link to ArcGIS map templates embedded in a project website on arcgis.com. These points accumulate on the web maps as data is collected, illustrating the distribution of surveyed clusters and ensuring selected samples spatially represent the entire survey area. The server makes the data widely accessible to researchers and managers worldwide, who then can review the accumulating information in real time and approve it for wider dissemination, such as in the trachoma atlas.
ArcGIS for Server pushes the data onto more detailed maps that show the entire survey area, providing visual displays that aid health workers in more quickly identifying affected areas and people needing treatment.

“It was nice that we didn’t have to reinvent the wheel,” says Esri Professional Services applications developer Danny Hatcher, who set up the servers and wrote the Python script. “We could fit hand in glove with the existing process and turn it into a map ITI could use.”
Proof of Concept
Mann recalls her excitement when the Ethiopian developmental study began. Pavluck needed just half a day to train a team of local field-workers how to use the smartphones.
“Because the system is so simple, it isn’t necessary to train a highly specialized team,” Mann says.
When the field-workers in Ethiopia started collecting data, Mann and colleagues in Decatur could actually see it flow from the phones to their server.
“Python script ran at 2:00 a.m. every morning, converting the data into feature points, which I personally added to the first mapping template,” Mann notes. And as more data came in, the system automatically updated the website.
The researchers plan to add features if the system runs smoothly. “As we get into the rhythm of things, I’m sure we’ll want to tweak our system,” Mann says. “But right now, we’re trying to keep it as simple and straightforward as possible.”
Haddad says researchers are looking at other neglected tropical diseases and, thanks to GIS, can more clearly see gaps in defenses against them. “This system is making a huge impact on how we run our programs,” he says. “It allows us to make much faster decisions on what we need to do.”
For more information, contact Rebecca Mann, geographic information systems data manager, International Trachoma Initiative, Task Force for Global Health (tel.: 404-592-1467), or Danny Hatcher, Esri. Also, visit www.taskforce.org, www.trachoma.org, www.trachomaatlas.org, and www.trachomacoalition.org.

