Esri gives promising startups a boost by helping them incorporate location analytics into their services and solutions. With the goal of bringing truly innovative products to market, the Esri Startup Program offers select new businesses access to the ArcGIS platform at no cost. Participants also receive training, support, and marketing opportunities.
Hundreds of startups from around the world are enrolled in the program, including the following three inventive companies.

Analyzing Web Map Movements
Most marketing departments use web analytics to determine how effectively their websites are grabbing and holding readers’ attention. Now, Sparkgeo’sMaptiks provides businesses with insight about their web maps’ activity.
The tool shows how people navigate a web map—zooming in and out, panning, and clicking on or tapping specific features. It calculates the user velocity as well, which measures the speed at which a user views the map and how he or she interacts with it, indicating where a viewer slows down to read the content or speeds up to skip it.
With this kind of business intelligence, companies can increase the returns on their web investments by building more effective maps.
Consider how this would be useful for a real estate company. Most realty websites include maps locating properties that people might be interested in viewing and, ultimately, purchasing. Maptiks analyses reveal how potential buyers use the mapping app to find neighborhoods that interest them. By tracking readers’ navigational habits, real estate professionals can see on which areas of the map people slow down and determine what is catching their attention. Using these indicators, the Realtor can make better inferences about the neighborhoods that interest prospective buyers and then build marketing strategies around that.
Local governments can use Maptiks as well to determine how engaged citizens are in particular topics. That way, governments can gear their open data efforts toward community concerns. For example, if constituents show a lot of interest in a road rehabilitation map—panning and zooming considerably and slowing down when certain content appears—then this topic is likely important to community members and may demand more attention.
Through the Esri Startup Program, Sparkgeo gained access to ready-to-use templates in ArcGIS Online and ArcGIS API for JavaScript, which helped the company build its tool.
“The Startup Program has been a really valuable way for us to engage with the Esri community,” noted Sparkgeo CEO and geospatial developer Will Cadell. “Esri provided the right introductions to the right people [not only]within Esri, [but also in] its partner ecosystem and among its clients.”
Discover how Sparkgeo can help you create more effective web maps.
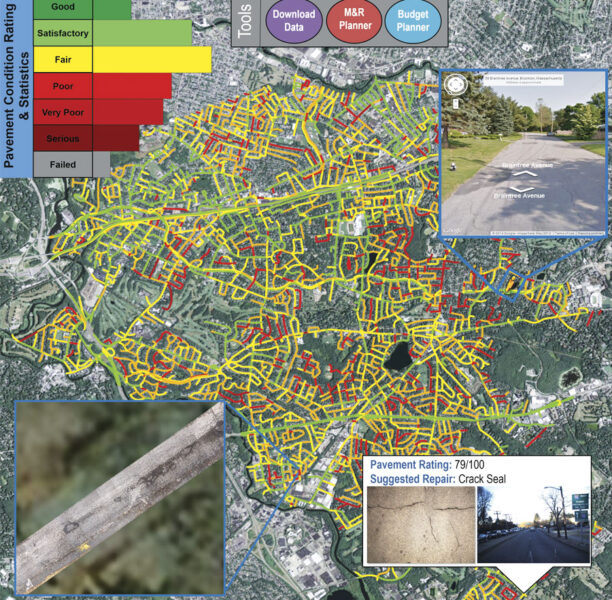
Evaluating Pavement Conditions
Before beginning a citywide transportation project, the City of Newton, Massachusetts, contacted StreetScanto help assess road conditions throughout the city.
StreetScan’s ScanVan uses a range of sensors—including GPS, microphones, and video cameras—to automatically measure cracks in the pavement. It also has ground-penetrating radar that detects pockets of air and pools of water in the pavement’s subsurface layers. The ScanVan gathered information on 276 miles of roadway in Newton.
The startup then used its pavement monitoring system, PAVEMON, to model the data. PAVEMON uses the ScanVan’s sensor data, along with traffic and climate information from other sources, to generate road condition maps. It also predicts future pavement conditions and determines what it would cost to fix any problems. PAVEMON then rates the road conditions of every mile on a scale from zero to 100, with zero being the worst and 100 being ideal.
StreetScan reported that Newton’s overall pavement condition index (PCI) was 59.3—almost 13 points below what is considered industry standard. Some roads were rated as low as 35.
With this science-based documentation, the city council was able to prioritize a 10-year road improvement strategy.
StreetScan designers used Esri’s custom toolboxes, ArcGIS API for JavaScript, and ArcGIS API for Python to build its apps. Additionally, ArcGIS Desktop and ArcGIS Online enable PAVEMON to efficiently combine large amounts of different types of data to produce a comprehensive and georeferenced inspection.
Now, public works departments can figure out the various and specific stresses on asphalt and pavement, which allows them to prioritize needs, plan projects, and develop long-term maintenance strategies.
Get more information about StreetScan’s intelligent roadway inspection services.
Automating Compliance Documentation
Even if a utility company complies with the Environmental Protection Agency (EPA) regulations enacted by the state in which it operates, that utility might not have enough staff or the proper technology to complete the required inspection documentation.
This was the case for Salt Lake County, Utah, when it didn’t have its storm water documentation together for the EPA’s inspection. The county was fined $280,000.
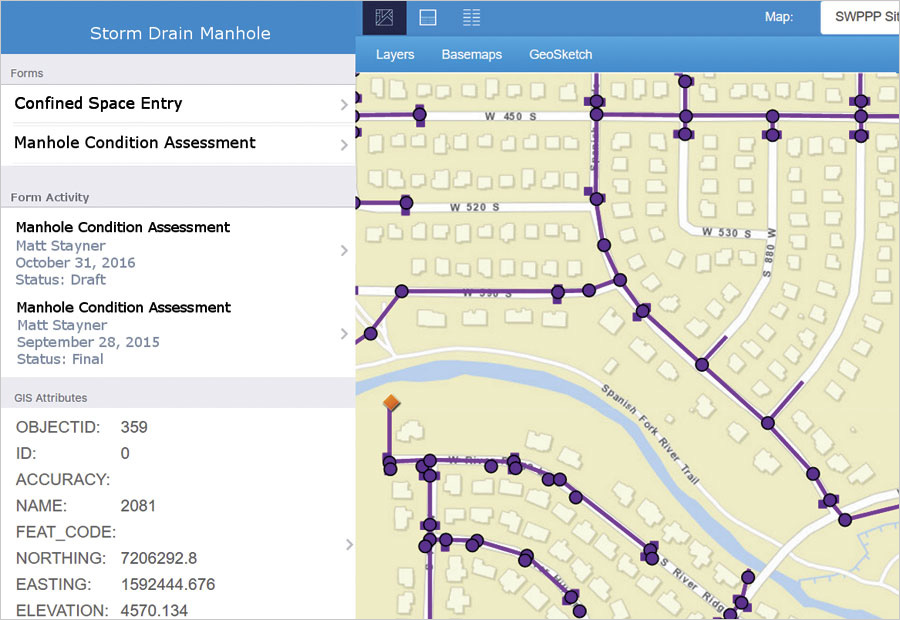
In an effort to prevent this from happening again, the county turned to UtiliSync, which helps companies manage documents. The startup used ArcGIS API for JavaScript to build a GIS-based solution.
Using UtiliSync on their mobile devices, field crews from Salt Lake County now complete their inspection reports on-site. Because the solution is tightly integrated with ArcGIS, staff members can just tap on a map feature—such as a manhole, water valve, or construction site—and immediately find the correct form for that asset. After the inspection form is completed, UtiliSync automatically generates a PDF report and distributes it to the appropriate parties. It also saves a copy within the program itself for compliance purposes.
Now, Salt Lake County uses UtiliSync to document all its storm water inspections. So the next time the county gets audited, the auditor will be able to open a map, click on a feature, and instantly see the up-to-date inspection documents that verify the utility’s compliance with EPA regulations.
View an interactive demonstration to see how UtiliSync improves operational efficiency.