The Palace of Versailles and its surrounding estate stretch across nearly 2,000 acres. The estate comprises 120 buildings, including the King’s Apartment, the Royal Chapel, and the House of Mirrors. Deeper in the park, visitors will find the Petit Trianon estate; the Versailles Orangerie; and several parks and gardens designed by King Louis XIV’s gardener, André Le Nôtre.

For much of the estate’s existence, the finer details of managing its parks mostly survived unofficially as institutional knowledge passed down through the years. For example, only a few people at any time understood the water network and which keys operated the extraordinary hydraulic system.
In 1995, France’s ministries of culture and budget formalized park operations under the Palace, Museum, and National Estate of Versailles (known by the acronym EPV), a public corporation with administrative and financial autonomy. EPV now employs 900 people.
In the mid-2000s, EPV took steps to implement a new management plan. One of the goals was to design a GIS-based tool that would help visitors understand the estate’s history and heritage. Its sheer size proved daunting.
“The estate occupies 140 plots, spread over eight cities, with roads and even railways,” Élise Legrand, EPV’s GIS specialist, said during a talk at a GIS event last year. “This presents management difficulties and [consistency] problems. EPV had access to digital databases, but there was no common link between them.”
In 2017, EPV launched a garden management plan for the estate that called for a GIS solution. The agency partnered with Arx iT, a GIS services company and longtime Esri partner based in France and Switzerland. ArcGIS Enterprise provided the tools to create and publish web maps, web apps, and web services.

The GIS infrastructure became operational in 2022. Arx iT integrated existing data from multiple sources. A basemap was gradually assembled by looking at historical documents.
“It’s a fantastic challenge to digitize and assemble dozens of Cassini maps in Lambert projection,” says David Boillée, a project manager and GIS architect at Arx iT.
Boillée’s team discovered that some of the gardens, waterways, and flowerbeds had remained virtually the same over the centuries. These served as reference points for much of the geographic data.
EPV uses two GIS applications as part of its management plan.
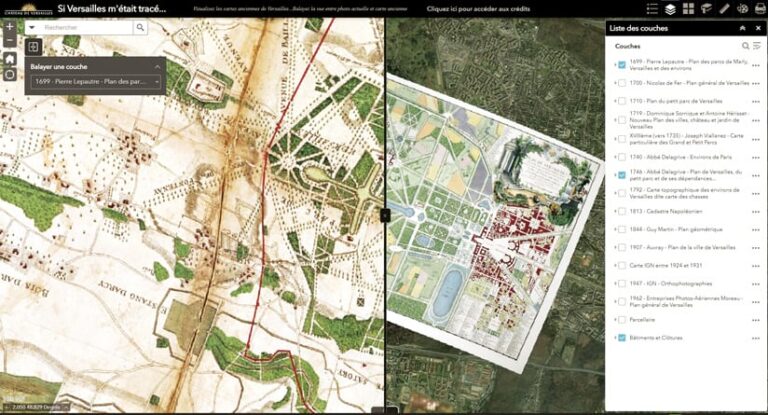
Si Versailles m’était tracé (which translates as if Versailles was drawn for me), the first app, overlays aerial imagery with 14 georeferenced old maps of the Versailles estate, dating back as far as 1699, and allows users to swipe between the new and the old. The app offers a unique opportunity to discover the estate from a historical perspective, see the evolution of its buildings and the layout of its land, and examine previously inaccessible map archives. From an operational perspective, it is used for architectural studies, archaeological excavation, and historical reconstruction.
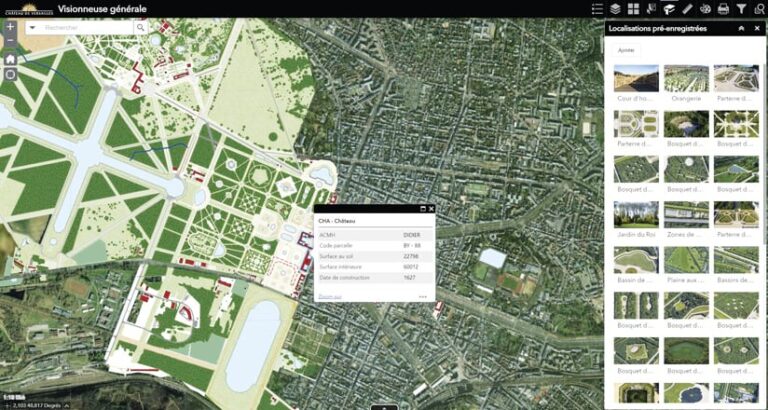
The second application is solely for internal use and forms the backbone of the management plan. A global viewer within the app uses a dedicated basemap that provides details of the grounds, including the wooded areas, walkways, and buildings, as well as the walls and fences that mark the boundaries of the estate.
“For example, the queen’s grove was restored in 2020,” Legrand said. “With the global viewer, we can see the gap between what currently exists and what existed before restoration work was underway.”

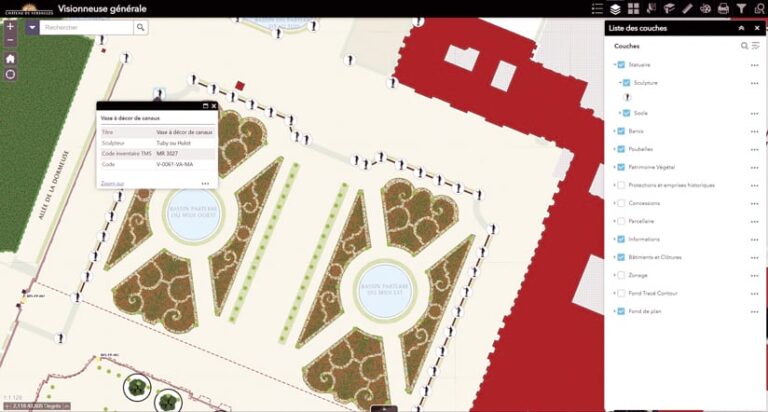
Dedicated map layers provide more specific information relevant to the maintenance of the park. These include details on the gardens, driveway conditions, sculptures, benches, and trash receptacles. Clicking on a pop-up window reveals related details for every attribute.
“A user can examine the maintenance history of an individual bench,” Legrand noted.
Over time, she added, the viewer will evolve as more data and layers are added to the map.
In the coming years, EPV will focus on the behind-the-scenes networks—such as electricity, water, and fiber optics—that are essential for the ongoing management of Versailles. EPV also plans to create a history of the landscaping of Versailles, displaying the evolution of trees and plantings over the years. A mobile app is also in the works.
As information accrues and layers are added to the map, details of Versailles’ past are revealed, helping to ensure its future.
“In effect,” Legrand said, “GIS helps different sources of information exist in a dialogue with one another.”

