A Demographic Look at the United States in 2013
A word that could describe the current demographic state of the United States is change. Population and household types continue to change as a few categories grow and diversify, while others decline. Although a number of regional economies are showing positive signs of recovery, lingering effects of the Great Recession continue to hamper growth of the national economy. Job creation remains sluggish, and the growth of household income is negligible. There is concern that rapidly increasing home prices in some markets may trigger another housing bubble.
Population Growth and Decline
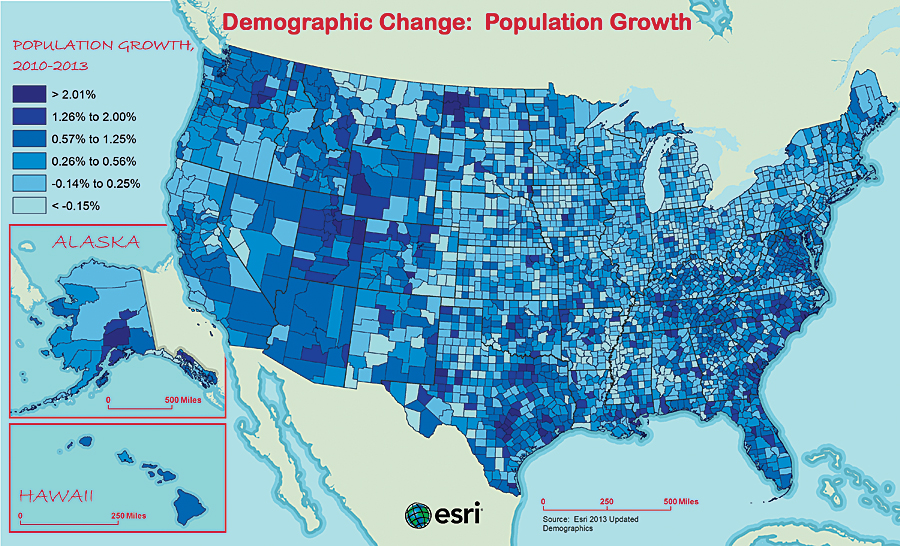
Characterized by growth and decline, the US population in 2013 is 314 million. Population in the South and West is growing nearly three times faster than in the Midwest and the Northeast. Reasons vary for the fastest-growing metro areas, such as The Villages, Florida (+13.6 percent)—retirees and seniors; Jacksonville, North Carolina (+7.6 percent)—military presence; Kennewick-Richland, Washington (+6.5 percent)—farming and nuclear production; Austin-Round Rock, Texas (+6.5 percent)—technology and education; and Myrtle Beach-Conway-North Myrtle Beach, South Carolina/North Carolina (+6.1 percent)—tourism. By number, Harris County, Texas; Maricopa County, Arizona; and Los Angeles County, California, have added more than 100,000 people to their populations since 2010.

Traditionally slow growing, populations in North Dakota and Montana are exploding, due in large part to new innovations of extracting oil and natural gas from the Bakken Oil Shale. Employment opportunities in the mining industry have increased by +6.5 percent nationally since 2010.
Conversely, the slowest-growing or declining areas include Flint, Michigan (-2.2 percent); Binghamton, New York (-1.1 percent); Detroit-Dearborn-Warren, Michigan (-1.0 percent); Mansfield, Ohio (-1.0 percent); and Niles-Benton Harbor, Michigan (-0.9 percent). Counties with the largest declines are Wayne County, Michigan (Detroit); Cuyahoga County, Ohio (Cleveland); and Genesee County, Michigan (Flint). These Rustbelt areas suffer from high unemployment as jobs were lost in manufacturing and other heavy industries when companies either moved away or closed.
Increasing Population Diversity
Diversity continues to increase and change the makeup of the population. Esri’s proprietary Diversity Index accurately summarizes racial and ethnic diversity in an area. This measure shows the likelihood that two people, chosen at random from the same area, belong to different races or ethnic groups. The index ranges from 0 (no diversity) to 100 (complete diversity). Esri’s Diversity Index for the United States has risen from 60.6 in 2010 to 62 in 2013, with a forecast of 64.8 in five years. At 82.1, Hawaii is the most diverse state in 2013; Maine has the lowest diversity at 12.5.
There are several reasons for the increase in population diversity. The non-Hispanic white population is shrinking by a process called natural decrease. The Census Bureau noted recently that for the first time in nearly 100 years, deaths exceeded births among non-Hispanic whites. Demographers had expected this natural decrease, but not until later in the decade. Another factor may be that whites are also either delaying or eschewing parenthood altogether due to economic constraints, such as inadequate employment or student loan debt. Most births in the United States are now to Hispanic, black, and Asian mothers, helping to account for the more dramatic changes in diversity. Based on the current growth rates by race and ethnicity, non-Hispanic whites will become the minority in approximately 30 years. This minority shift will occur more quickly in the younger population than in the total population.
Changing Household Types
The composition of America’s 119 million households is also changing. Although husband-wife families remain the dominant household type, their share of all households continues to slip—from 52 percent in 2000 to 48 percent in 2010. From 2000 to 2010, the real increase in family households was in single-parent families, up by 22 percent, and multigenerational households, up by 30 percent. Husband-wife families increased by less than 4 percent in 10 years, and husband-wife families with children declined. Growing segments of households include nontraditional family types, such as single person, single parent, multigenerational, and same-sex partners.
Housing
Although positive signs are noted in areas more affected by the housing boom/bust and employment decline, recovery of the overall housing market remains slow. The 2013 homeownership rate of 64 percent remains the same as in 2012. The 2013 median home value for owner-occupied households increased to $177,247, up 5.7 percent since 2012. More people are renting, perhaps because homeownership is still out of reach due to tight credit and the difficulty of obtaining a mortgage, despite historically low rates. Although home prices are increasing (faster than the 2006 rates in many areas), particularly in areas hardest hit by the housing market crash, most of this growth is merely the return of prices to prerecession levels. Fewer homes are “underwater.” Vacancy rates are down in more than 44 percent of counties. Additional recovery setbacks occurred regionally in areas hit by natural disasters, such as Hurricane Sandy in New York and New Jersey and the Waldo Canyon Fire in Colorado. Even though the housing market shows signs of recovery, depending on supply and mortgage rates, household income growth remains anemic.
Income
According to Esri’s 2013/2018 Updated Demographics data, the median household income for 2013 is $51,300, 2.3 percent higher than in 2012, but still lower than the 2010 figure of $54,442. Disparity remains; income rose for only the top 20 percent of households. Unknown is the impact of the Sequester, depending on the number of federal employees affected and the time they are “furloughed.” Income for the average household will grow only if steady employment with regular pay raises is available. Industry sectors that are hiring include mining, administration and support, and waste management.
About 2013/2018 Updated Demographics
How can you learn more about the demographics of the United States? Esri’s 2013/2018 Updated Demographics data can provide answers. To perform actionable location analytics in these challenging times, you need the industry’s most accurate, trusted data. Ranked number one for accuracy in a blind, independent study, Esri’s demographic estimates and forecasts were produced with proven methodologies to provide the highest possible level of accuracy.
Esri’s 2013/2018 Updated Demographics database includes a full roster of current-year estimates and five-year projections for categories such as population, income, race/ethnicity, home value, net worth, disposable income, and more.
Delivered in a variety of geographies and formats, Esri 2013/2018 Updated Demographics data can be accessed as a map service from ArcGIS Online and in products including Esri Business Analyst Online, Business Analyst for Desktop, Business Analyst for Server, and Esri Community Analyst. The data is also available by table or database for seamless integration into GIS software.
For more information about Esri 2013/2018 Updated Demographics, visit esri.com/demographicdata.

