The Chesapeake Bay watershed spans 64,000 square miles across six US states and the District of Columbia. To manage the environment in this vast area, having accurate land-use and land-cover information is imperative. Existing datasets, such as the National Land Cover Database (NLCD), have been extremely useful in identifying priority zones throughout the watershed that are in need of conservation and restoration. This data, however, often lacks the resolution required to examine, track, and identify fine-scale trends or make parcel-scale decisions that focus on restoration efforts.
, the Chesapeake Conservancy's high-resolution land-cover dataset (top) can break down dense urban development in places like Washington, DC, into details—such as buildings, roads, and street trees—that are valuable for planning restoration projects.")
Recognizing the importance of having data-sets that can achieve these goals, some counties and municipalities commissioned small-scale initiatives to produce high-resolution land-cover information for areas under their jurisdiction. While this information has aided local decision-making, the land-cover classification categories differ across boundaries, as do data accuracy and resolution. The data wasn’t widely available either, which made it difficult to use high-resolution land-cover data for larger policy making and restoration endeavors.
To bridge the gap between local and regional efforts, the Chesapeake Conservancy, a nonprofit organization based in Annapolis, Maryland, proposed a project to create consistent high-resolution land-cover data for all 206 counties that comprise the Chesapeake Bay watershed area. Using ArcGIS, the conservancy and its partners developed a dataset that makes it easier to pinpoint high-priority restoration and conservation areas. The Chesapeake Conservancy is also collaborating with the Chesapeake Bay Program (CBP) and the US National Park Service to use the dataset to implement environmental projects in the area.
Data Discrepancies Hamper Progress
In 2010, the Environmental Protection Agency put the Chesapeake Bay on a pollution diet to restore the health of the watershed’s rivers, streams, and creeks. Called a Total Maximum Daily Load (TMDL), the diet’s goal is to decrease by 20 percent or more the amounts of nitrogen, phosphorus, and sediment in the water by 2025. The TMDL has directly affected state- and countywide policies and regulations throughout the watershed and stimulated a number of new pollution reduction initiatives at local levels.
To model, track, and manage statewide progress toward reaching these water goals, CBP—a regional partnership that helps lead, direct, and manage restoration efforts in the Chesapeake Bay—relies heavily on land-use and land-cover data. Before 2015, CBP calculated its watershed-wide pollution numbers using the 30-meter resolution NLCD. But there were still discrepancies between the NLCD and the higher-resolution datasets being employed by local planners.
“This resulted in inconsistencies when comparing local evaluations with CBP’s modeling, which made planning, implementation, and reporting very difficult,” said Jeff Allenby, the Chesapeake Conservancy’s director of conservation technology.
CBP partners recognized that having a high-resolution land-cover dataset of the entire watershed would not only improve their ability to quantify the effects of existing and in-progress restoration efforts but also would have very real implications on planning new restoration projects. Thus, in 2015, CBP commissioned the Chesapeake Conservancy to upgrade the land-cover data for the entire watershed. Working with the University of Vermont’s Spatial Analysis Laboratory and Esri partner WorldView Solutions, the conservancy created a one-meter-resolution dataset for the Chesapeake Bay watershed and all the counties that intersect its boundaries.
“Our project covers more than 100,000 square miles—beyond the boundary of the Chesapeake watershed—to give the border counties complete pictures of their landscapes,” said project manager Cassandra Pallai. “This makes the CBP dataset one of the largest high-resolution land-cover datasets in the [United States].”
Building a Consistent Dataset
To execute the update, the Chesapeake Conservancy developed a multistep image classification workflow using ArcMap, ArcGIS Pro, and the image processing software ENVI from Esri partner Harris Corporation.
“Since the conservancy had to make the classification technique adaptable to diverse landscapes, we opted for a rule-based methodology,” explained Colin Stief, an app designer at the Chesapeake Conservancy who helped create the protocol. “Trees, for example, were categorized as tall, green, and as having a high vegetative index.”
The project analysts broke the multistate region into areas composed of 8–12 mosaicked National Agriculture Imagery Program (NAIP) images, each the size of a United States Geological Survey (USGS) digital orthophoto quadrangle, or quarter quad. The NAIP images, collected between 2013 and 2014, were one meter resolution and had four spectral bands: red, green, blue, and near infrared.
Where lidar was available, staff used ArcGIS Desktop to create mosaics of digital elevation models (DEMs) and LAS datasets of lidar-derived point clouds. Then, using the mosaicked imagery’s footprint as a processing extent, analysts implemented an iterative process in ModelBuilder to create complementary digital surface models (DSMs) of landscape height. This height information and a Normalized Difference Vegetation Index (NDVI) layer were appended onto the four-band NAIP mosaics as fifth and sixth bands.
Other data used in the project included the most up-to-date high-resolution, leaf-off imagery (with pixel sizes between 15 centimeters and one meter). When available, the conservancy also incorporated county, state, and federal planimetric (2D) datasets to enhance the classifications of road, structure, and impervious features.
Relying on proprietary rule sets, analysts used ENVI to segment the tiles of the aerial imagery and organize them into five to seven classes. Once the data was categorized to analysts’ satisfaction, they exported the results in both raster and shapefile formats. The analysts then used ArcGIS Desktop to manually correct the polygon versions of the classifications. Using an object-based methodology for accuracy assessment that was designed for high-resolution land-cover data, they also analyzed each county individually in ArcGIS Pro and made additional corrections in ArcMap.
From there, local experts in each watershed county reviewed the completed datasets to further ensure their accuracy.
“This was incredibly important for improving county staffs’ confidence in the TMDL pollution models,” said Pallai. “It was the first time that most of them had [contributed] to CBP’s pollution calculation process.”
The final watershed-wide dataset ended up being about 90 percent accurate. Once everything was finished, the conservancy and CBP used available county parcel, zoning, and land-use information to classify the land-cover data into land-use data, the tabular form of which will be incorporated into the TMDL water quality evaluations.
Restoration Projects Get a Boost
Given that water quality regulations such as the TMDL underlie most of the restoration work done in the Chesapeake Bay watershed, this new dataset has quickly become essential. It gives CBP, the conservancy, and the watershed’s environmental stakeholders the technological power to make effective decisions about where to target their restoration efforts.
For example, in 2016, the Chesapeake Conservancy partnered with Pennsylvania’s York County Stormwater Consortium to incorporate the land-cover data into a customized, web-based tool that streamlines and standardizes the data, calculations, and formatting for the storm water project reports that the county’s 44 municipalities submit. Now, the consortium can identify, compare, and prioritize the most cost-efficient projects to help York County achieve its water quality goals.
Additionally, at George Washington’s Mount Vernon estate, along the Captain John Smith Chesapeake National Historic Trail, the Chesapeake Conservancy is helping protect the natural vista by conducting a viewshed analysis. With the conservancy’s higher-resolution data, users can estimate a more accurate viewshed by including a precise representation of on-the-ground features like trees and buildings. The conservancy also built a web app that allows anyone to calculate the visual impact of new development or tree loss by selecting specific parcels and drawing in hypothetical buildings of various heights.
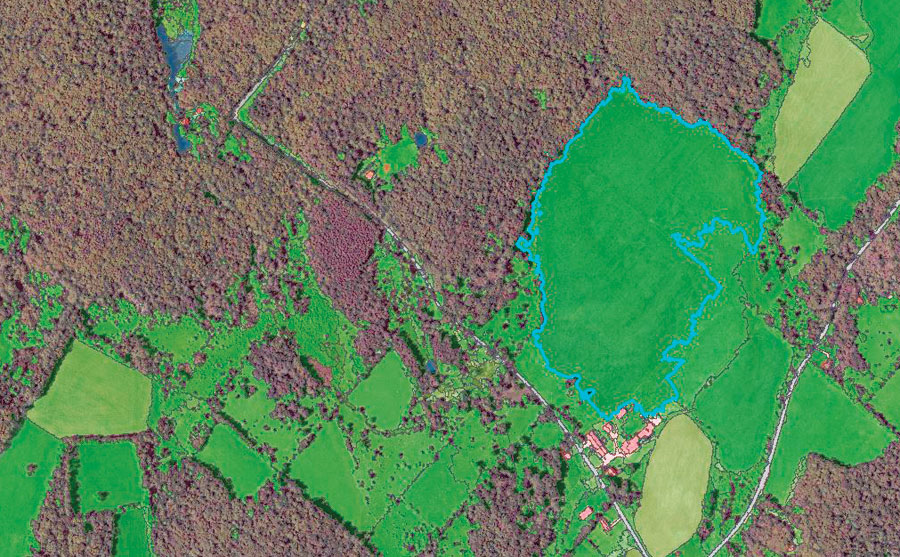
To supplement the land-cover data, the Chesapeake Conservancy has developed a methodology as well that identifies flow paths in areas where surface water tends to concentrate. Using the new land-cover and flow path data in the ArcGIS platform, the conservancy is able to identify natural buffers by distinguishing trees, wetlands, or shrubs within 35 feet of a stream or river.
“From there, we can analyze which buffer gaps would be higher-priority restoration projects by…quantifying the area [of land] that is draining into each gap,” said David Saavedra, a new member of the conservancy’s GIS team. “Gaps with drainage areas containing a large percentage of impervious or agricultural surface areas could become a high priority for restoration because they contribute more pollution than those dominated by forest or wetlands.”
“It is really exciting to be at the forefront of a product that will fuel a revolution in the way the landscape is modeled and managed,” added Allenby. “This land-cover product is groundbreaking in many ways.”
To download the data and view webinars on use cases, visit chesapeakeconservancy.org. For more information, email Allenby.