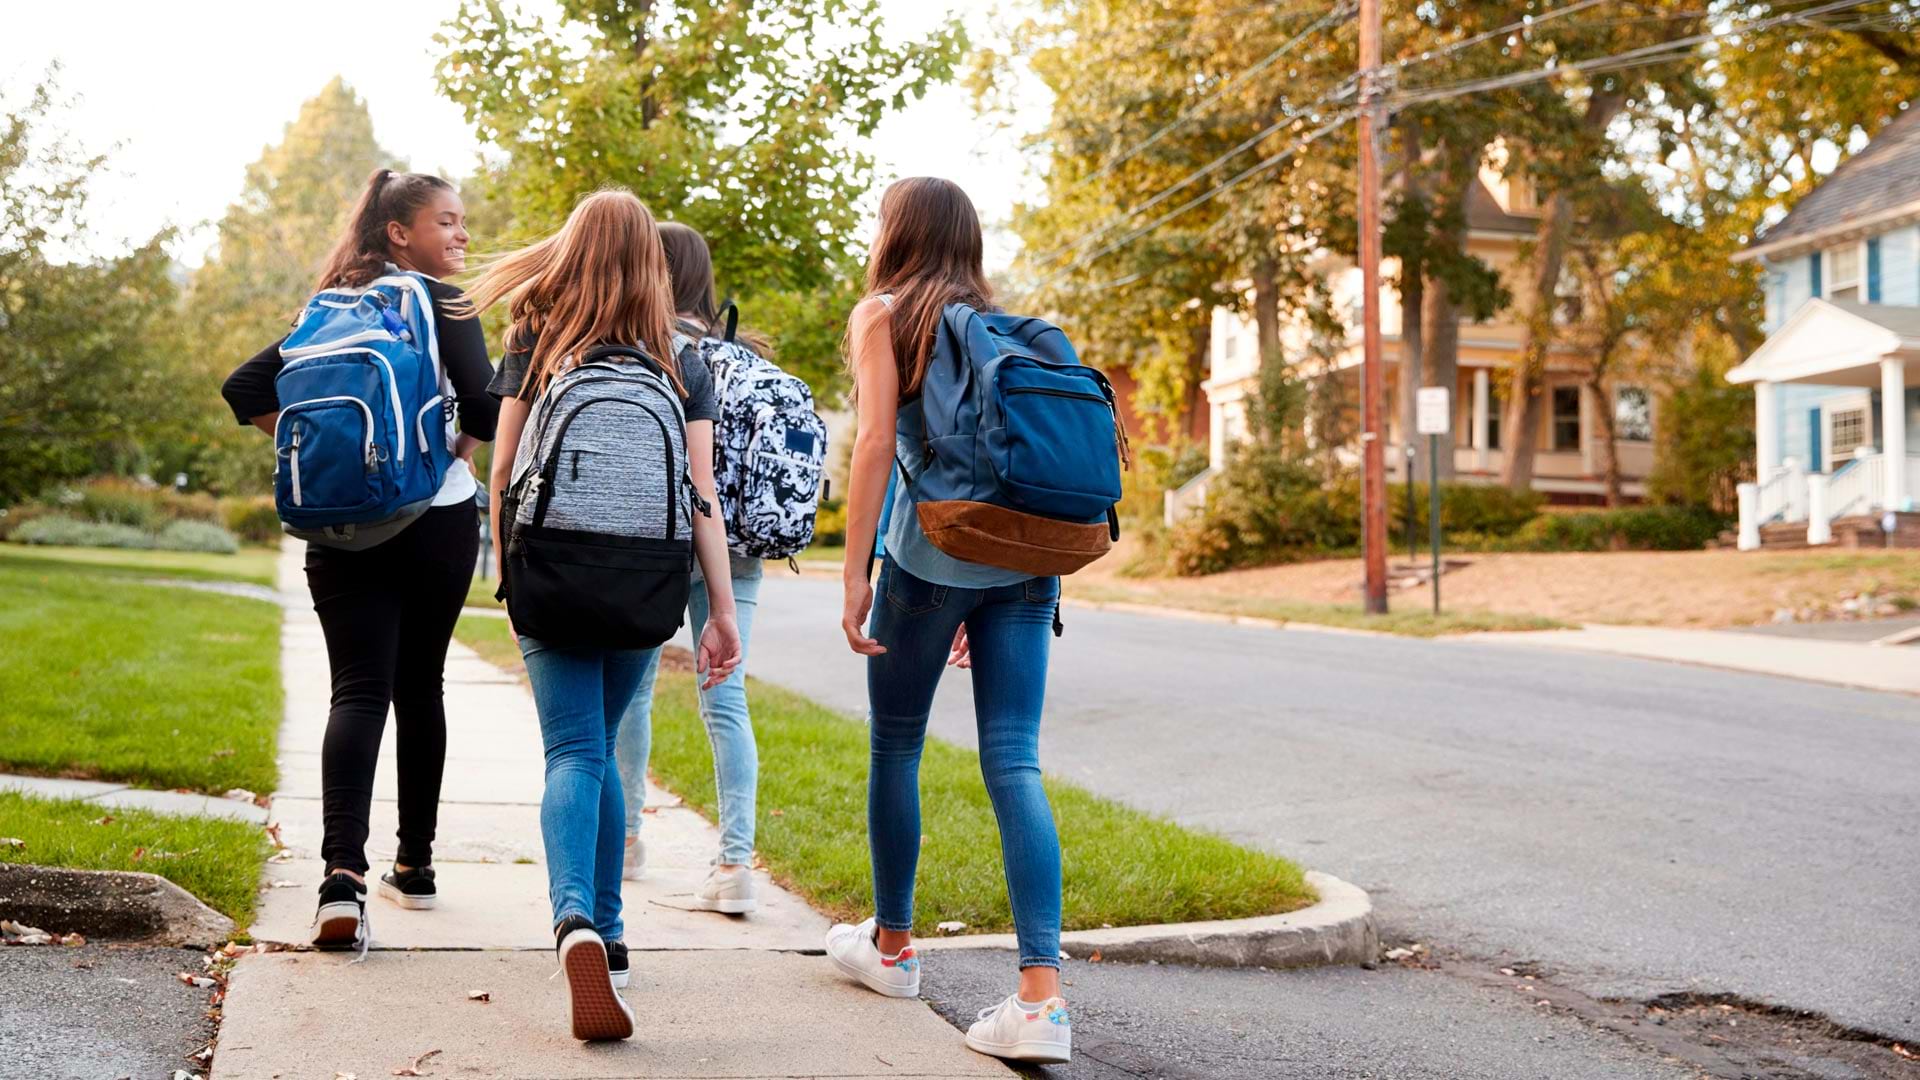
School-age youth make up 23 percent of residents in the Bay Area community of Lafayette, California. When you add parent drivers, almost a third of the city’s residents travel to and from Lafayette’s six K–12 schools each day to attend school or drop off and pick up students.
Drop-off and pickup times near schools are hectic, with buses loading and unloading, kids hopping on bikes and scooters, and parents navigating vehicles along busy roads. Lafayette has limited sidewalks near schools and in many residential neighborhoods, so most students are driven to school, creating unsafe conditions for the fewer kids who walk or bike. Many parents and guardians witness this less-than-ideal pedestrian environment and choose to drive, increasing traffic and, in turn, further discouraging kids from walking and biking.
In theory, if safer walking and biking routes were more visible and well-known, parents would be willing to let their kids walk or bike to school. And if fewer cars drove to and from schools, arrival and dismissal would be safer for everyone, encouraging more kids to feel comfortable walking and biking.

To test this theory, local high school student Miela Hsu used GIS to create interactive proof-of concept maps that outline suggested routes for walking and biking to four area schools.
“My mom used GIS in her job about 10 years ago, and she recommended that I try using ArcGIS Online to make the maps because it was pretty intuitive,” Hsu said.
After learning how to make maps with ArcGIS Online, Hsu used ArcGIS Field Maps to collect data about pedestrian and bicycling amenities around schools. Hsu presented parents with a survey built with ArcGIS Survey123 to determine whether receiving information about safer pedestrian and bicycle paths around schools would change their driving behaviors. She also created stories with ArcGIS StoryMaps to show residents and members of the city council examples of what information a suggested-route-to-school map could contain.
Learning GIS and Gathering Data
Hsu kicked off the project by exploring many of the tutorials available for learning ArcGIS Online. These made it easy for her to learn basic GIS workflows, such as how to create features and symbolize them on a map, as well as more advanced concepts like creating buffers and generating travel areas. The Make a Walk-Time Map tutorial, available on ArcGIS Blog, taught Hsu how to build the fundamental data she needed: the streets that were within a quarter mile, a half mile, and three-quarters of a mile of schools.
Because the City of Lafayette does not have an extensive GIS data catalog, Hsu created all the features either on the computer using ArcGIS Online or at school sites using ArcGIS Field Maps. Within ArcGIS Online, she employed the Generate Travel Areas tool to define the walking and biking area polygons and to find the streets within three-quarters of a mile of each school using the Include reachable streets parameter.
“ArcGIS Online had a lot of basemaps to choose from, as well as analysis tools that helped me identify feasible distances to expect kids to be able to walk,” Hsu said. “Being able to categorize the roads by type using preexisting data, and having many icons to choose from, made creating the maps easy and fun.”
Hsu then inspected the streets on foot to determine where there were sidewalks and multiuse paths that schoolchildren could use. She also assessed each path’s condition. The objective was to find the safest and longest uninterrupted paths possible, so she surveyed the streets to identify any gaps in pedestrian and cycling infrastructure. During the survey, Hsu found that some necessary connectors were of very low quality. For example, some asphalt pathways were deeply cracked or had tree roots growing up that made them uneven, and some roadways had no shoulder.
An important aspect of the pedestrian and bicyclist experience is the presence of road safety features such as crossing guards, traffic signals, rapid rectangular flashing beacons, and crosswalks. Amenities such as bike racks at schools and nearby remote drop-off and pickup locations can help encourage walking and bicycling as well. Hsu looked for these features in person and recorded data about them in ArcGIS Field Maps.
Building an ArcGIS StoryMaps Story
Using ArcGIS StoryMaps, Hsu quickly built an interactive story that led with the narrative of why walking and biking to school is good and how students could do both of these safely in Lafayette.
. The top shows map snippets.")
In her related maps, further down in the story, Hsu depicted the best pedestrian and cycling options, using green lines to denote suggested sidewalks or walkways and purple lines to display suggested multiuse paths. She symbolized low-quality connecting paths with red dashed lines. To add visual interest to the maps, she included custom vector symbols that represent crossing guards, traffic lights, flashing pedestrian beacons, bike racks, and school drop-off and pickup zones.
Hsu presented maps of two neighborhoods—each with two schools in it—using the Floating Sidecar layout in ArcGIS StoryMaps so that users could explore the areas around the schools while simultaneously seeing the map’s legend. She wanted users to be able to see what all the symbols mean without having to scroll.
At the end of the ArcGIS StoryMaps story, Hsu included an image of the Lafayette School District’s traffic safety rules.
Getting Results
Hsu wanted to test the theory that an ArcGIS StoryMaps story featuring suggested walking and biking routes to school could help parents find paths that they would consider having their kids try. She circulated a version of the story that included an embedded ArcGIS Survey123 form. Parents and guardians were asked what schools their children attend; how they take their kids to school; what they thought of the maps; and, having received that information, how likely they were to let their kids try walking or biking to and from school.
Nearly half of the respondents said they learned a new route from the maps. Of the parents and guardians who had only driven to school previously, 90 percent said they would try parking a quarter of a mile away from their kids’ school and walking the rest of the way for drop-off and pickup. These results showed the value of suggested-routes-to-school maps in encouraging parents to help decrease congestion and increase safety around Lafayette’s schools.
As cochair of the city’s Youth Services Commission, Hsu emailed Lafayette’s mayor and several city councilmembers to see if she could present her findings to them. The mayor and a city councilmember agreed to meet with her, so Hsu created a third ArcGIS StoryMaps story to display her results.
“Presenting my work to the mayor and a councilmember was a great way to show what I found around the schools and give them suggestions for spots that could be improved,” Hsu said.
The government officials appreciated Hsu’s detailed work and the findings she presented.
“Over the past few years, our city focused deliberately on [making] safety improvements near schools,” said Lafayette Mayor Susan Candell. “This mapping project filled a real need for parents and students, and we are grateful to Miela for providing this new, valuable resource for our residents. In addition, it helped identify gaps in our sidewalk system that we included in our improvement program.”