
The electricity industry landscape in the United States is entering a transformative era. For decades, retail electricity prices rose gradually, largely in step with inflation and infrastructure costs. Over the last several years, however, a new set of drivers—the explosive growth of data centers and AI workloads—has begun to reshape how power is consumed, planned, and priced across regions.
A newly published ArcGIS Living Atlas of the World layer, USA Electricity Rates – Electric Retail Service Territories and Hexagons, provides spatial and temporal insight into how residential electricity rates have changed from 2000 through 2024. The layer is a resource for planners, policymakers, utilities, and researchers seeking to understand emerging electricity cost patterns in the near future.
Rising Demand, Rising Rates
Electricity demand nationwide has surged alongside digital infrastructure growth. Hyperscale data centers—essential to cloud computing, AI training, and real-time apps—consume vast amounts of power, often comparable to small cities. In 2023, US data centers accounted for roughly 4 percent of national electricity use, with demand projected to grow significantly by the end of the decade, according to a recent report from the US Department of Energy.
-
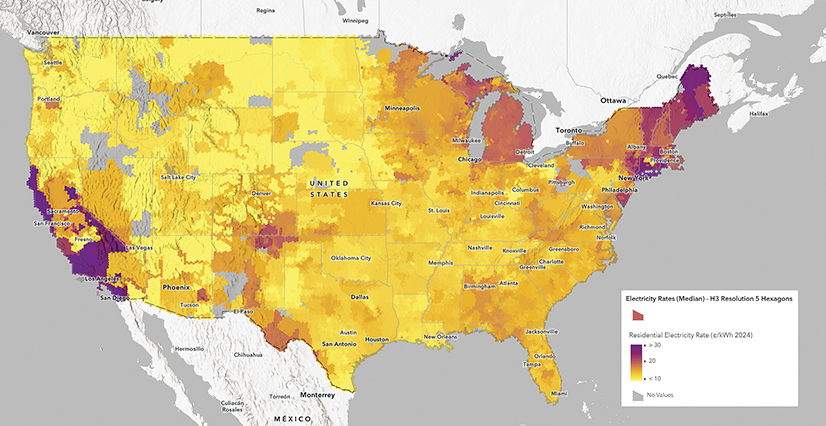
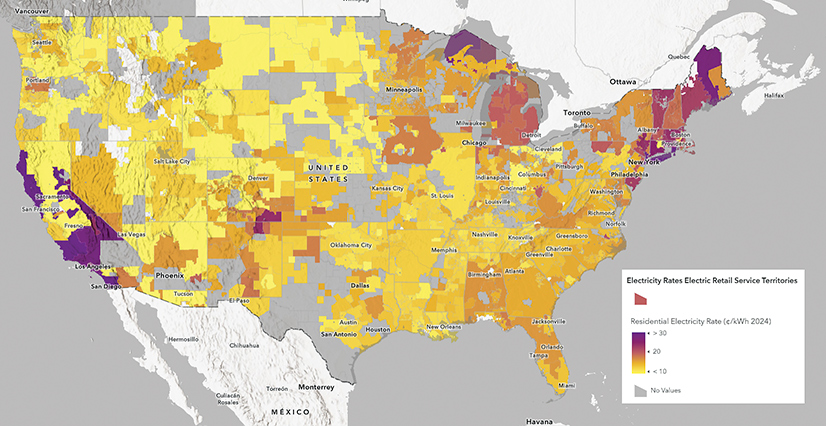
H3 resolution 5 hexagons, shown in the first map, reduce the distortion caused by irregular service territory boundaries, shown in the second map.
At the same time, residential electricity prices have climbed. According to the US Energy Information Administration (EIA), the average price of electricity in the United States increased by nearly 10 percent between 2022 and 2024, with additional increases projected through 2026. These changes reflect a combination of factors:
- Deferred infrastructure investment and grid hardening in response to extreme weather
- Rising operational costs tied to aging generation and transmission systems
- Rapid load growth driven by energy-intensive AI and data center facilities
Mapping Trends and Geographic Variability
The ArcGIS Living Atlas layer integrates EIA electricity rate data with electric retail service territory boundaries and introduces hexagon grids to improve visual clarity and analytical consistency. By using uniform spatial units, analysts can compare rate trends across regions without distortion from irregular utility boundaries.
Key patterns revealed by the dataset include the following:
- Broad nominal electricity rate increases over the past two decades
- Inflation-adjusted regional differences, including areas with real price declines driven by efficiency gains or competitive markets
- Emerging hot spots where electricity rates have risen sharply over the last two years, often aligning with areas that are rapidly developing data centers
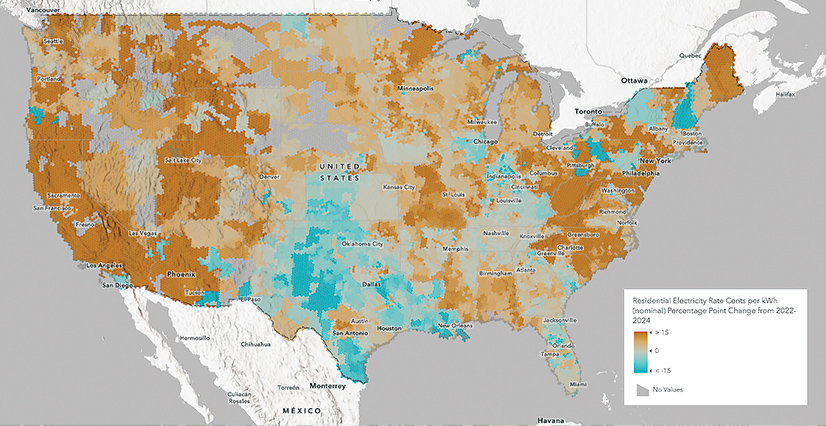
Interactive maps derived from the layer, including percent-change and cents-per-kilowatt-hour views for 2022–2024, help reveal where affordability challenges may be intensifying.
Using H3 Hexagon Grids for Consistent Spatial Analysis
To support consistent analysis of electricity rate trends nationwide, the ArcGIS Living Atlas layer uses H3 resolution 5 hexagon grids created in ArcGIS Pro. H3 is a global, hierarchical hexagonal indexing system that provides uniform spatial units, reducing the distortion caused by irregular service territory boundaries. Resolution 5 hexagons offer an effective balance between geographic detail and performance, supporting regional-scale analysis while maintaining visual clarity.
When the H3 grid was generated in ArcGIS Pro, it was filtered to include only hexagons that intersect electric retail service territories, ensuring that all summarized values represent areas where electricity rates apply. Electricity rate features were then aggregated to the hexagons using the Spatial Join tool.
-
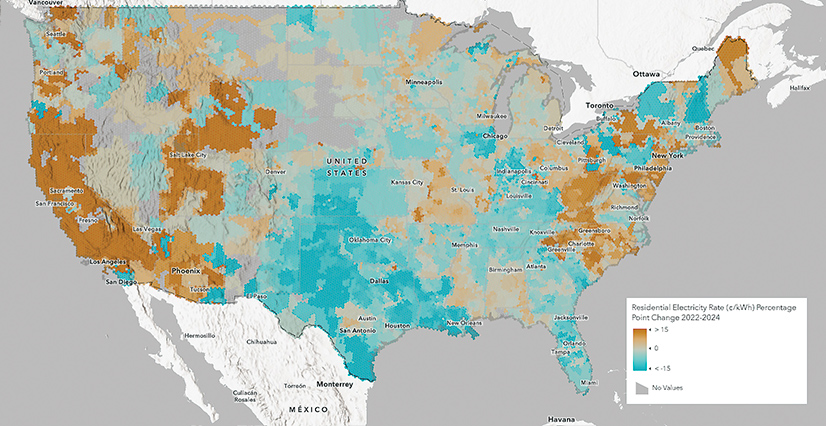
Electricity rates have generally gone up from 2022 to 2024, shown as a percent change in the first map and relative to what they were before (a nominal percent change) in the second map.
Within Spatial Join, the Field Map parameter was used to calculate descriptive statistics for each hexagon, including median, mean, and maximum electricity rates. The median provides a measure of central tendency, the mean reflects overall average conditions, and the maximum highlights localized high-cost areas.
Using hexagons improves comparability, scalability, and map readability, making it easier to identify regional patterns and emerging hot spots associated with data center- and AI-driven electricity demand.
Data Centers, AI, and the Grid
The scale of modern data center energy use is reshaping utility load profiles across the country.
For example, in an area stretching from North Carolina to Pennsylvania to Michigan that is served by one regional transmission organization, the PJM Interconnection, data center demand has become a dominant source of new load growth. This has prompted significant investments in generation, transmission, and distribution infrastructure. Recent results from PJM capacity auctions, which ensure that enough electricity is available for future demand, reflect tightening supply relative to demand, signaling upward pressure on future electricity costs.
Looking ahead, forecasts suggest that by 2030, data centers could consume up to 12 percent of US electricity, intensifying challenges for grid reliability and long-term planning. Utilities and regulators are increasingly grappling with how to accommodate large industrial loads while maintaining equitable rate structures for residential customers.
Planning for the Future
Understanding the evolving electricity landscape requires both robust data and strong spatial context. The ArcGIS Living Atlas layer enables users to
- Conduct spatial analysis of electricity rate changes at local, regional, and national scales.
- Do temporal comparisons that highlight how regions have diverged over time.
- Plan different scenarios to assess future demand growth, infrastructure needs, and rate impacts.
As AI-based computing demand continues to accelerate, resources like the USA Electricity Rates layer provide visibility into how past trends are shaping today’s electricity markets—and can help stakeholders anticipate the challenges and opportunities ahead.