How Harford County, Maryland, Transformed Its Field-Based Workflows
Harford County, Maryland, has a storied history and an intriguing future. Stretched across 437 square miles of land northeast of Baltimore, the county was founded right before the American Revolution and now has a forward-thinking government that uses technology—particularly GIS—to better connect with its 250,000 residents.
As an Esri Enterprise Agreement customer, Harford County is aiming to deploy GIS across its entire organization, incorporating it into more workflows and using it to be more efficient and transparent. Because there is usually a learning curve when implementing GIS at various levels of an organization, two GIS coordinators at Harford County took advantage of Esri Training courses to gain the knowledge and skills they needed to help the county navigate its digital transformation. Most recently, this helped Harford infuse its fire hydrant inspection and maintenance workflows with GIS. The results have been impressive.

A Constant Game of Catch-Up
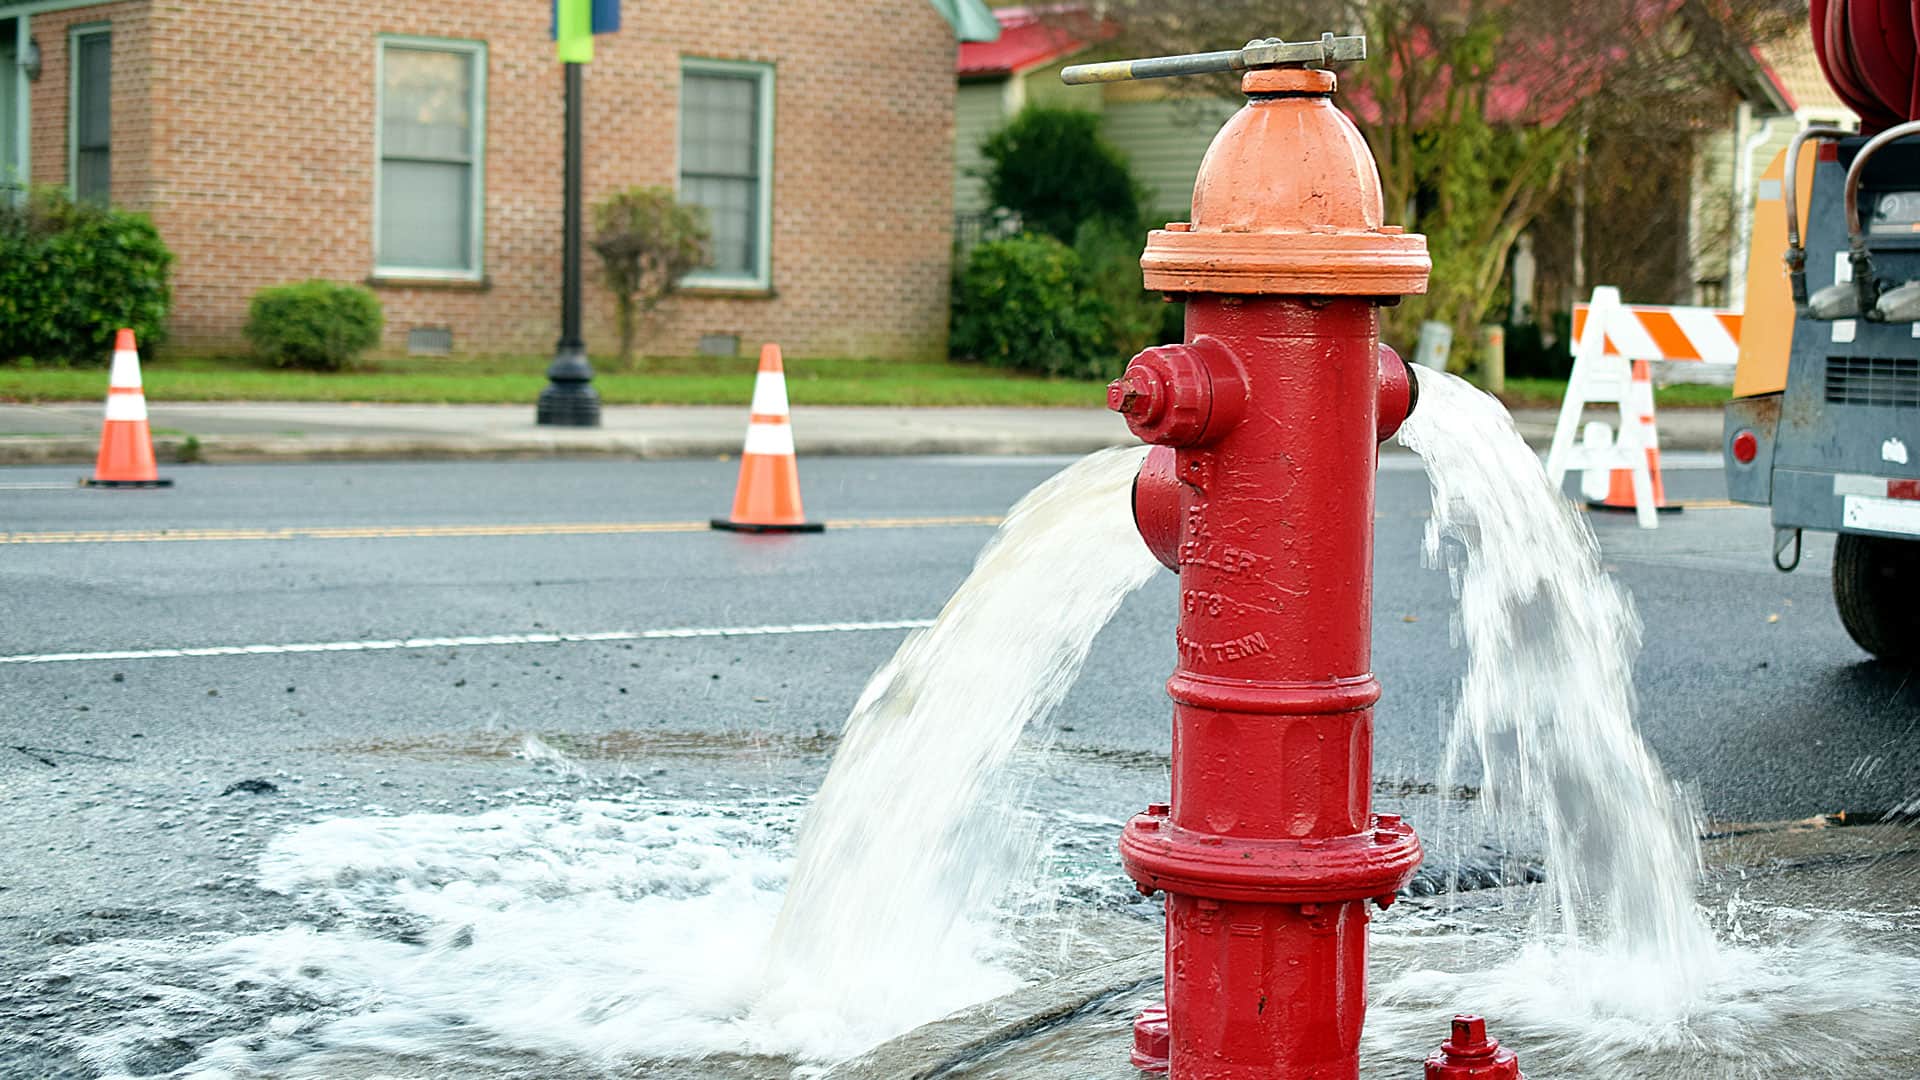
Harford County has approximately 4,200 fire hydrants, and they all need routine maintenance each year to ensure that they are in proper working order and ready to use.
“We can’t have a firefighter hooking up to a malfunctioning hydrant when there’s a fire,” said Chad Gibson, GIS coordinator for the water and sewer division of the county’s department of public works.
During the inspections, which occur between April and October, maintenance workers typically determine that about a quarter of the hydrants require flushing. This scours the pipes to remove any built-up material that could impede water flow, so crews perform that on the spot. They also take chlorine readings for each hydrant to ensure that chlorine levels are appropriate and that the disinfectant isn’t being discharged into the environment.
The entire inspection process required crews to spend about 20 minutes at each hydrant. That means it would take approximately 1,400 hours, or 35 full workweeks, to inspect all the hydrants in Harford County—which is longer than the seven-month time frame the county allots for the work.
What’s more, Harford’s hydrant maintenance workflow has historically been paper based, which is resource intensive and even more time-consuming. According to Gibson, fieldworkers doing the inspections would attend a meeting each morning to pick up paper maps that assigned them to grid-based zones around the county. Out in the field, these workers would use a printed spreadsheet to write down each hydrant’s asset ID number, the amount of time the hydrant valve was open, and the chlorine reading. When the work was complete, crews would use a marker to highlight that hydrant’s dot on the printed map before moving on to the next hydrant location.
At the end of the day, maintenance workers would turn in their highlighted paper maps and spreadsheets to administrative staff who were tasked with entering the data into the county’s work order system. Unsurprisingly, this data entry was painstaking and slow. The three administrative staff members who performed it often had to work overtime to get it all done.
“The whole process could take up to a year,” said Gibson. “And only about 2,700 hydrants would be inspected and updated in the [GIS] system. Every year we were playing catch-up.”
But now, that paper-based process is history.
Bringing a Real-Time Workflow to Fieldwork
Harford County had actually had a digital asset management and work order system from Esri partner Cityworks-Azteca Systems in place for several years. In 2018, the county decided to integrate Cityworks into field operations. Maintenance workers were given iPads with the Cityworks app on them. So Gibson and his colleague Steven Headley, the county’s GIS coordinator, decided that they wanted to incorporate ArcGIS mobile solutions into this system as well.

Specifically, Gibson and Headley had heard about ArcGIS apps for the field. They were curious and wondered what might be possible given the county’s new digital approach to field-based asset management. To find out, they signed up for an Esri instructor-led training class.
While attending the Field Data Collection and Management Using ArcGIS class in June, Gibson and Headley discovered that a lot was possible. Gibson was particularly excited about potential uses for Operations Dashboard for ArcGIS.
Soon after the class, he applied what he learned to create a dashboard that integrates with the Cityworks app. By then, maintenance crews were using Cityworks on their iPads to conduct their hydrant inspection work.
With Operations Dashboard, Gibson “fired up a dashboard in about 20 minutes,” he said. Since deploying it, the results have been “huge.”
Now, as fieldworkers inspect and flush (if needed) hydrants, they update the asset data directly on their iPads, using Cityworks, instead of on paper. After the data for each inspected hydrant is entered, the dashboard gets updated in real time.
From there, everyone in the office and out in the field can use the dashboard to see the real time status of all the work being performed in each zone of the county. An indicator shows, by color, exactly how many hydrants have been inspected. Purple means the work has been completed, while red shows all the inspections that are outstanding.
“This is a huge time-saver and changes everything for [maintenance workers],” said Gibson. “The dashboard is super motivating because they can see progress.”
And while it used to be difficult for supervisors to monitor the status of in-progress fieldwork, now they can see, at any given time, exactly where crews are working and how many hydrants have been inspected.
What’s more, if workers out in the field identify a problem while inspecting a hydrant, they can create and submit a work order immediately via the Cityworks app instead of waiting to notify someone when they return to the office. This ensures that hydrant maintenance issues are addressed quickly, which is another key benefit of the county’s modernized field workflow.
An Unprecedented Pace
By implementing the new workflow during the 2018 maintenance cycle, Harford County was able to inspect its hydrants at an unprecedented pace. All 4,232 of them were inspected a month and a half ahead of schedule.
Maintenance workers no longer need to attend a morning meeting to pick up paper maps, and they don’t have to stop by the office after they complete their inspections to drop off their spreadsheets. Making updates on the iPad is quick and easy, and fieldworkers have more time to actually perform the hydrant work. So they can get more done in less time.

This is a huge time-saver and changes everything for [maintenance workers]. The dashboard is super motivating because they can see progress.
Additionally, administrative staff no longer need to manually transfer paper-based hydrant data into the county’s asset management system. The GIS database now automatically stores up-to-date, accurate hydrant data based on the most recent field inspections.
Gibson estimates that for 2018, the automated field data collection workflow saved the county at least $35,000 in labor costs alone.
And “we’re getting all the work done,” he added.
Continuing the Digital Transformation
While making GIS a central component of field workflows was huge for Harford County, that’s not where its digital transformation stops. Next, the county plans to implement Esri’s Local Government Information Model and is working with Esri Professional Services to prepare its data.
Headley, who had a eureka moment during the Putting ArcGIS to Use Across Your Organization training class, now wants to equip the county’s non-GIS staff with ArcGIS capabilities. He thinks there are plenty of projects that could benefit from GIS-powered insights.
Having deployed both an ArcGIS Online organizational site and an ArcGIS Enterprise portal, the county has the means to enable widespread use of GIS maps and apps among its staff—and realize additional positive results that benefit its residents and local businesses.