
Utility Uses Map-Based Website to Help Companies Get Head Start on Development
With a service territory spanning 200,000 square miles and the largest electricity transmission network in the United States, American Electric Power (AEP) is uniquely positioned to support business expansion and community development in its service region.
AEP’s economic development team works closely with local communities and state agencies to promote economic growth. In 2015, the team generated 170 business attraction and retention projects that created 22,500 jobs throughout its service territory.

Promoting economic development across a large and diverse footprint requires efficiently integrating multiple systems to provide interested parties with timely and accurate information in a variety of formats. With this in mind, AEP recently redesigned aeped.com, a highly focused economic development website that furnishes data to site selectors and companies looking to potentially expand in the electric utility’s 11-state service territory.
The website—which was built using the ArcGIS platform—showcases featured properties, contains information and analysis on various states’ characteristics, and provides data on business feasibility for key industries.
The Central Role of Maps
AEP provides electricity to parts of 11 states: Arkansas, Indiana, Kentucky, Louisiana, Michigan, Ohio, Oklahoma, Tennessee, Texas, Virginia, and West Virginia. Throughout its seven operating companies, AEP employs economic development managers who are supported by a centralized economic and development group.
Within this group, the operations team handles a range of marketing, research, and GIS requests. Each request requires individual attention, though many similarities among them do exist.
That is why AEP’s economic development website (a collaboration between AEP’s corporate communications department and Adept Marketing) contains general data on frequently requested items and provides several interactive features for customized, self-service research. Unsurprisingly, maps play a central role.
“Geography is fundamental in economic development,” said Mark James, AEP’s vice president of economic and business development. “Economic developers [primarily] sell location, and our new website makes it easy to see why AEP and our service territory is the best choice for their next expansion project.”
For the aeped.com redesign, AEP’s economic development team exploited several Esri tools. ArcGIS for Desktop was used principally to create the thematic and analytical maps that display a wide range of data. The team employed Esri Business Analyst Online extensively to construct drive-time polygons for potential development sites, as well as to report business and demographic data for various geographies. The WordPress plug-in for ArcGIS Online was used to integrate several ArcGIS hosted web maps into the website. And the team employed the Pictometry extension for ArcGIS for Desktop to incorporate oblique imagery (aerial photos taken at about a 45-degree angle) where appropriate.

Unveiling Certified Sites
To help businesses speed up their location search, AEP offers development sites that are precertified by independent consultants for use as industrial zones, data hubs, and food centers.
“These sites have a competitive advantage because the designation meets certain readiness that ensures shortened start-up time frames,” said Roland Peña, director of economic development for the City of San Angelo, Texas. “Simultaneously, companies are conducting regional analysis, and aeped.com’s infographics, maps, and data are helpful for influencing the deadline-driven process of site selection by providing up-to-date business location and facts.”
Certified sites are displayed on individual pages that each feature a map gallery. The maps on these pages (which are generated using ArcGIS for Desktop) include an aerial view of each site that identifies its key features, a local proximity map that shows how many people live within a specific radius relative to the site, and a one-day truck drive map that displays 200-, 400-, and 600-mile buffers—approximately how far a truck could drive in a day, depending on various factors—around the selected area. Each map gallery also features a drive-time analysis, completed using Business Analyst Online, to show the available workforce within 20-, 40-, and 60-minute drive times, as well as bird’s-eye view images (where available) made with the Pictometry extension for ArcGIS for Desktop. The maps and, in many cases, their accompanying analyses are available for download in PDF.
Accessing State-Level Development Data
AEP’s economic development website details the advantages of doing business in each of the company’s 11 states. It addresses infrastructure, business climate, workforce, and electric service.
As with the certified site pages, the state pages feature a map gallery composed of maps created in ArcGIS for Desktop. For each state, there is a transportation map; an AEP service territory map; an AEP certified sites map; and a proximity to markets map, which utilizes US Census data and information available in Business Analyst Online to calculate the percentage of the US population within a 600-mile radius of the state.
The state map galleries also include thematic maps, such as education levels and workforce characteristics throughout each state, as well as census and labor information. Additionally, users can employ an interactive map to select a county served by AEP and download its market profile, demographic and income information, and business summary reports (from Business Analyst Online).
Focusing on Target Industries
Based on the assets in its service territory, AEP focuses its business recruitment program on several key industries: manufacturing (automotive, plastics, and food and beverage processing in particular), data centers, and shale oil and gas.
For each target industry, the AEP economic development website includes detailed analyses of the fields’ workforce, transportation, existing industries, and business costs. The information is presented in a map gallery that integrates data from the US Census Bureau, the US Bureau of Labor Statistics, and the National Transportation Atlas Database, among other sources.
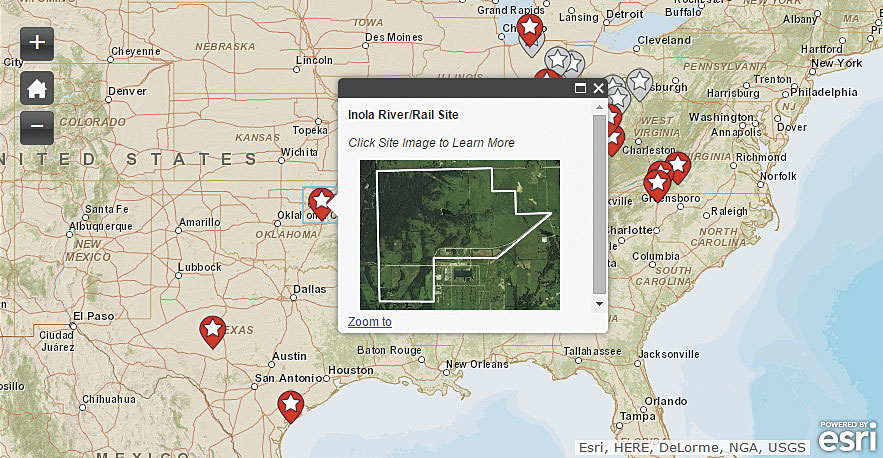
A tab on the page allows users to switch from the static map gallery to an interactive certified sites map. AEP created this responsive map using the WordPress plug-in for ArcGIS Online. The pop-up for each AEP certified site—which includes the site’s name and an aerial photo—allows users to either zoom in to the site on the map or open the particular certified site page in a new tab.
Additional Geographic Resources
Maps are used in other locations throughout aeped.com as well. The website’s blog includes a maps section that allows users to share individual maps and geographic information. Additionally, a service territory locator tool enables visitors to enter an address or geographic coordinates to determine whether their location is served by AEP. Should the visitor want to learn more, he or she could use this tool to send an email to the appropriate AEP contact, who would then connect with the interested party.
Future Development Plans
As more visitors use aeped.com, the AEP economic and business development team plans to use analytics from the website to improve its content and functionality. Given how important location information and maps are to economic development, the team also intends to seek new ways to integrate geographic data into the website and create tools that meet its audience’s needs.
For more information about the website, visit aeped.com or email Robb Watson.
About the Author
Robb Watson, GISP, is an economic and business development analyst with American Electric Power. He holds a master’s degree in city and regional planning from Ohio State University and a bachelor’s degree in geography from Miami University.
