Earth’s rising temperatures have a strong impact on African countries that are dependent on rain-fed agriculture. Climate change makes them vulnerable to drought, crop shortage, and extreme weather.
A community’s level of vulnerability to climate change can be measured by assessing its capacity for resilience. Resilience is weakened further by a government that lacks resources to support it, political unrest, and violent conflict. Government and aid organizations are using GIS to better understand where and how to lower climate change vulnerability and alleviate suffering for African communities.

The Robert S. Strauss Center for International Security and Law at the University of Texas at Austin coordinates the Climate Change and African Political Stability (CCAPS) program. Its purpose is to locate where security attention and foreign aid are most needed and offer advice about the types of intervention that best suit a situation. Several components of CCAPS research use Esri GIS technology. For example, researchers use GIS to model climate security vulnerability, track the location of conflict events in near real time, and assess the distribution of aid for climate change adaptation.
“The complex pathways from climate change to security impacts have demanded new datasets to fill knowledge gaps but also new ways of presenting the data to be of most use in policy planning,” says Francis J. Gavin, director of the Strauss Center. “The CCAPS mapping tool allows policy makers to analyze data from multiple sources at once, providing integrated analysis of the drivers and responses related to security risks stemming from climate change.”
The CCAPS Climate Security Vulnerability Model uses GIS to locate areas most vulnerable to climate change and understand the factors that contribute to that vulnerability. The model assesses four elements that influence vulnerability: physical exposure to climate-related hazards, population density, household and community resilience, governance, and political violence. Each source has its own set of indicators, which the model combines to assess how these factors coalesce to affect an area’s overall vulnerability.
By adding vulnerability assessments to GIS map layers and combining them with geocoded data from other areas of CCAPS research, analysts can see problem areas and understand how these issues intersect. If analysts want to study how regional conflict patterns in Uganda intersect with climate change vulnerability, they select areas to study on a basemap and add the climate vulnerability and conflict map layers. This makes it easy to see where and how these overlap.
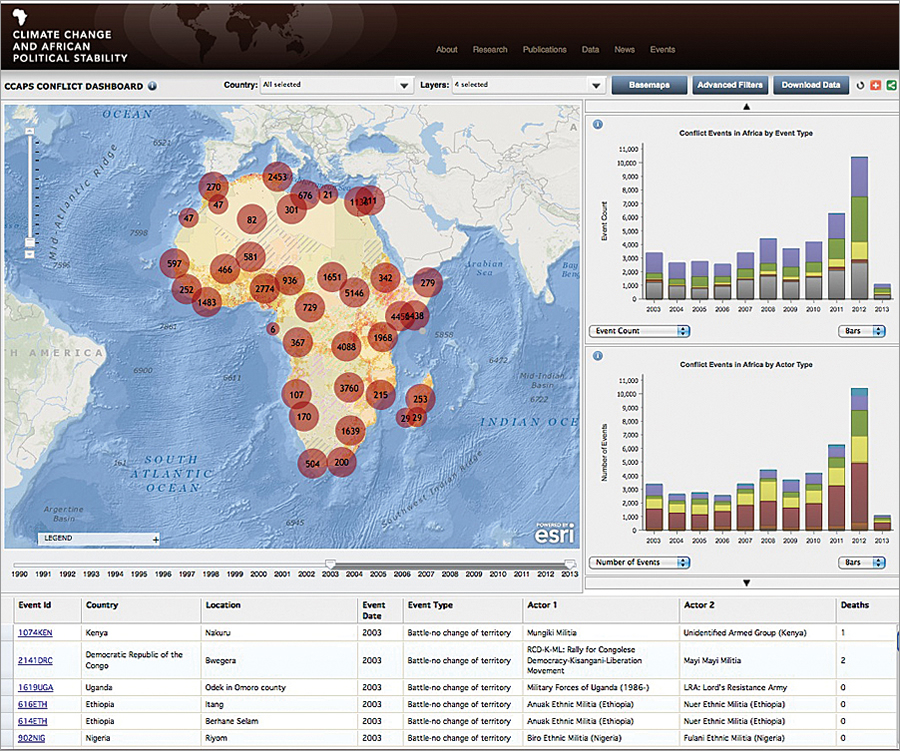
CCAPS program managers wanted to make it easy for anyone to use model data and maps. Therefore, the program partnered with Development Gateway (a nonprofit headquartered in Washington, DC) to create map dashboards that bring together mapping, trends analysis, tabular data displays, and data downloads for a comprehensive view of the areas under study on the program. The mapping tools were built using ArcGIS for Server and ArcGIS API for JavaScript. Dashboard users can apply a suite of filters for selecting attributes in the individual datasets. They can also access robust geospatial analysis, which was produced by CCAPS researchers.

The integrated CCAPS Mapping tool is an online mapping platform that enables researchers and policy makers to visualize data on climate change vulnerability, conflict, governance, and aid and to analyze how these issues intersect in Africa. The mapping tool allows users to select and layer any combination of CCAPS data onto one map to assess how myriad climate change impacts and responses intersect.
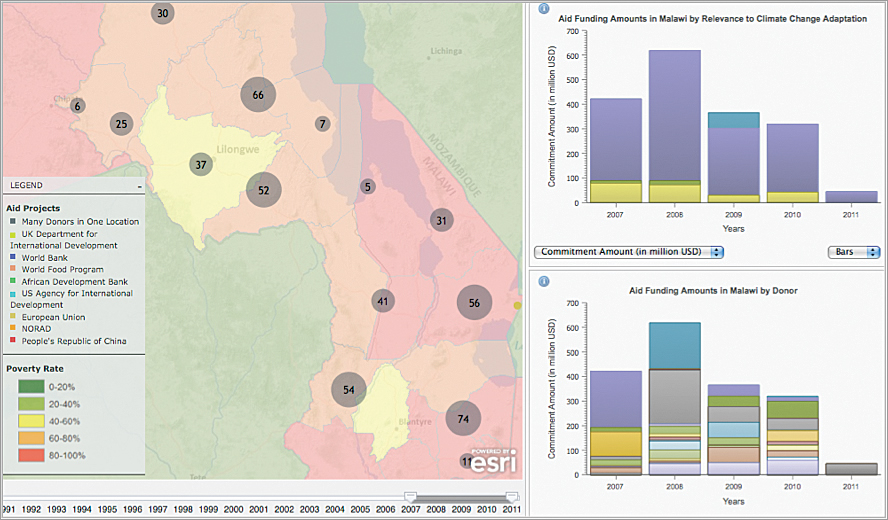
The CCAPS Aid Dashboard helps users see where aid projects are located. This dashboard is a collaborative effort that accesses datasets from CCAPS, the African Development Bank, and the World Bank that have been geocoded by AidData. This is the most comprehensive collection of geocoded data on aid projects in Africa. Using the dashboard’s tools, an analyst can filter aid data by year, sector, donor, recipient, and so forth, and see it on the map.
The CCAPS Aid Dashboard allows users to track aid by showing official donors in each sector of a given country. CCAPS and AidData published a geocoded and climate-coded dataset for Malawi. CCAPS rated aid projects according to their relevance to climate change adaptation and used the results to make a map layer. The user selects an area on the basemap and adds a map layer of climate adaptation-related projects. The user can then see if projects that are highly relevant to reducing vulnerability are actually located in vulnerable areas.
The CCAPS Conflict Dashboard gives a comprehensive view of emerging and historical conflict trends. This dashboard allows users to analyze conflict dynamics by actor, event type, issue, intensity, and so forth. By overlaying map layers, one can understand how conflict exacerbates climate change vulnerability and see where and how aid programs are trying to reduce conflict problems.
Development Gateway built the dashboards on ArcGIS for Server. Using ArcGIS API for JavaScript, developers added functionality that allows users to easily interact with the GIS and perform GIS tasks. Users can filter data to see the results as maps, charts, and tables and see them displayed on the dashboard.
Development Gateway designed the online dashboards so organizations that host them on their GIS servers can easily manage them on the back end. Organizations’ site managers select the datasets they want to include, preset filter defaults, set the year range, and specify donor organizations.
CCAPS datasets are available for download from the CCAPS program. The dashboard applications and geographic data layers are hosted on Development Gateway’s server. Once developers have finished developing and testing map applications, they will move them, along with the code and data layers, to the Strauss Center’s GIS servers.
For more information, contact Ashley Moran, senior manager, CCAPS program, Robert S. Strauss Center for International Security and Law, University of Texas at Austin.

