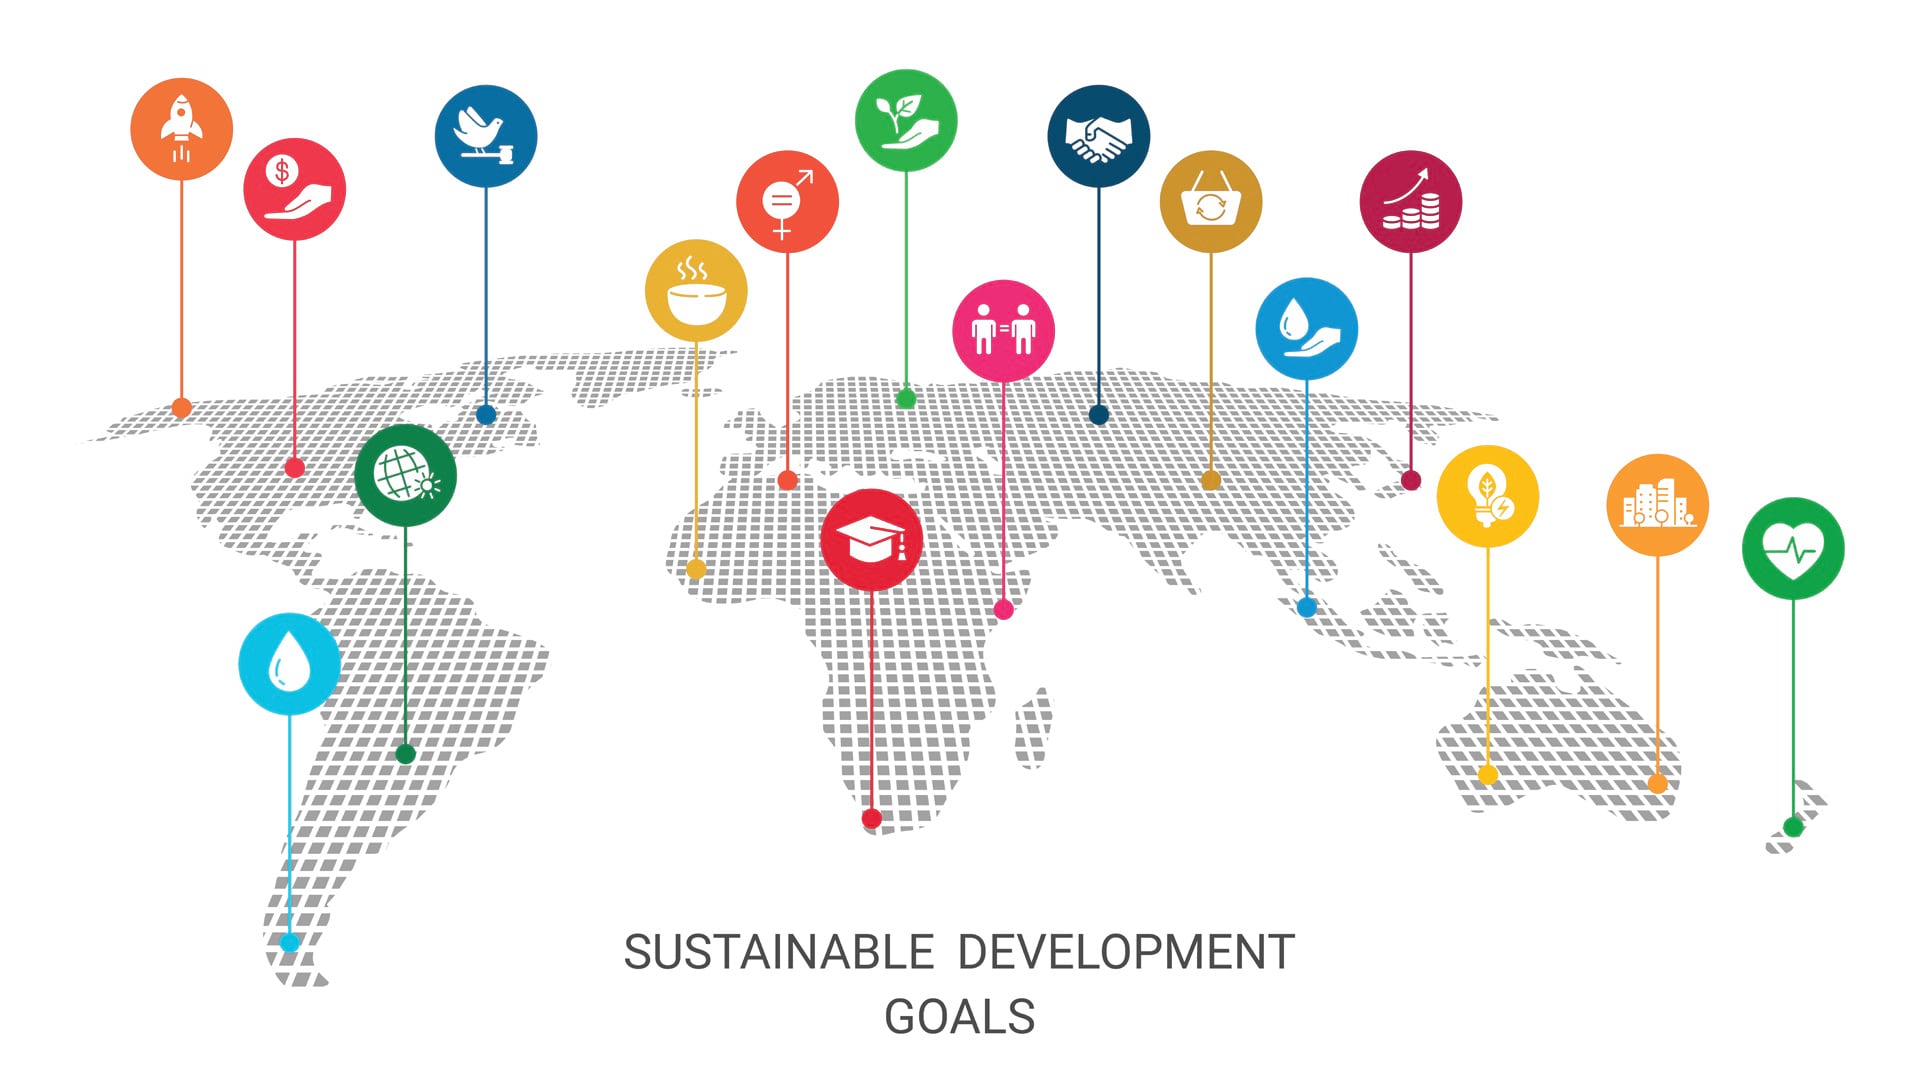
The Sustainable Development Goals (SDGs) were adopted in 2015 by United Nations (UN) member states as the overarching blueprint for addressing vital, global challenges to ensure a better, more equitable, and viable future for all. They are the essence of the UN’s 2030 Agenda for Sustainable Development, which seeks to eradicate poverty, heal and stabilize the planet, and build a peaceful world. But look at that date: 2030. The deadline is closing in on us—probably faster than many of us realize.

That’s why UN Secretary-General António Guterres declared 2020 as the start of a Decade of Action for achieving the 17 SDGs. Today, with less than eight years to go to reach these goals, all sectors of society need to mobilize to take both global and local action. Yet it can be difficult to understand where and how we’ve progressed in alleviating poverty, reducing inequality, supplying clean and affordable energy, and more—let alone comprehend what else we need to do.
Thus, maps are taking on an even greater importance in striving to realize the SDGs. They can help everyone—from governments to individuals—better understand each SDG and monitor progress toward assuaging the problems associated with them.
To this end, the UN recently prepared 17 maps of each of the SDGs that illustrate where we are in our quest to accomplish them. They follow on the release of Mapping for a Sustainable World, a free ebook written jointly by the UN’s Geospatial Information Section and the International Cartographic Association (ICA), that aims to democratize access to open data and cartographic techniques that people can use to better analyze the work being done toward achieving the SDGs. (For more information about Mapping for a Sustainable World, see “New Book Highlights Importance of Cartography in Achieving SDGs,” in the summer 2021 edition of ArcNews.)
Well-designed maps and diagrams effectively illustrate where there have been breakthroughs on the SDGs and where we need to focus on making more gains. Indeed, as Kyung-Soo Eom, chief of the UN’s Geospatial Information Section, advocates in the foreword of Mapping for a Sustainable World, it is imperative to use the power of cartography “to raise awareness and understanding on priority agendas for a better world, and to provide science and data for action and decision-making in moments that matter most.”
Mapping the 17 SDGs helps people appreciate the stories behind the goals, as well as the implications of each SDG for every country and the world. The 17 maps that the UN has produced tell compelling stories about the challenges the world faces regarding population growth, social disparities, climate change, food insecurity, economic inequalities, global health emergencies, natural hazards, and threats to peace and security.

For example, with regard to SDG 5—achieving gender equality and empowering all women and girls—many countries have made significant advances in sending more girls to school; forcing fewer girls into early marriage; and, as shown by the map above, gaining greater representation from women in national governments. But despite these gains, challenges remain. Discriminatory laws and social norms are pervasive, and women continue to be underrepresented in all levels of political leadership. Indeed, in 2020, only 24 percent of parliamentary leaders were women, and countries with substandard representation run the gamut of industrialized and developing nations. So there is still a ways to go before we achieve this goal.
The maps in the series are meant to spark awareness for the beginning of this Decade of Action and show people what we have left to do to achieve the SDGs by 2030 and create a better world. They should serve as both a testimony of the work that has already been done and as a compass for what challenges lie ahead. Yet these maps are only part of the story.
The expertise that GIS practitioners, data and geospatial scientists, cartographers, and others in this orbit have is critical for evaluating progress on the SDGs and the 2030 Agenda for Sustainable Development. We only have eight more years to fulfill our promise for a more equitable and sustainable future. So join us in mapping the 17 SDGs, and let’s see where else that can take us!