Supply chain issues beleaguered consumers throughout 2022. But perhaps none were as jarring as the baby formula shortage that distressed new parents across the United States from early summer almost through the end of the year.
One of the country’s biggest formula manufacturers recalled several products in February when four infants fell ill—and two of them died—after consuming the product. The company then ceased production at one of its plants for several months after bacteria was found on-site. Wider supply chain issues and inflation hindered efforts by other US-based manufacturers to increase production, and because the United States has stringent regulations for importing formula, it was difficult to get reinforcements from outside the country. By May, more than 40 percent of baby formula was out of stock in US stores, according to retail tracking group Datasembly.

As families desperately tried to find ways to feed their infants, Mothers’ Milk Bank in San Jose, California, faced drastically increased demand for the human breast milk it typically supplies to medically vulnerable infants and other families in need. Staff members at the organization recognized the pressing need to inform community members of the rapidly growing demand and seek out more breast milk donations. To do this, they turned to ArcGIS Pro and ArcGIS Business Analyst.
Accelerating GIS Use to Find Target Audiences
Mothers’ Milk Bank’s mission is to collect human milk donations safely and provide equitable access to this nutritional alternative to as many vulnerable families as possible. Typically, thousands of newborns in intensive care units and parents who are unable to produce breast milk rely on the organization’s services. Last year, parents with limited access to baby formula became another key customer.
Jonathan Bautista, executive director of Mothers’ Milk Bank, had previously experienced the value and effectiveness of using GIS to organize, analyze, and visualize imperative data while working for a blood bank organization. To reach more milk donors in 2022 and educate the milk bank’s community about the crucial need for donations, Bautista determined that GIS would be the best tool to use.
Bautista’s goals were to raise people’s awareness of a safe alternative to formula, provide the opportunity for breastfeeding parents to donate their breast milk, and identify which communities are most likely to donate. He also wanted to use Business Analyst to go through the same process that corporations and stores do to determine their target audiences.
Prior to implementing GIS in its work, Mothers’ Milk Bank relied on a self-built data management system, which was limited in its abilities to collect data, analyze it, and serve as a tool to make data-driven decisions. Bautista knew that applying a geographic approach to the problem he was trying to solve would bring location to the forefront and provide new insight.

“Something we are hoping to accomplish by implementing GIS is to reach as many prospective donors as possible and increase the likelihood [that they will] donate their milk, if possible,” said Bautista.
Adjusting Marketing Messages to Connect Donors with Demand
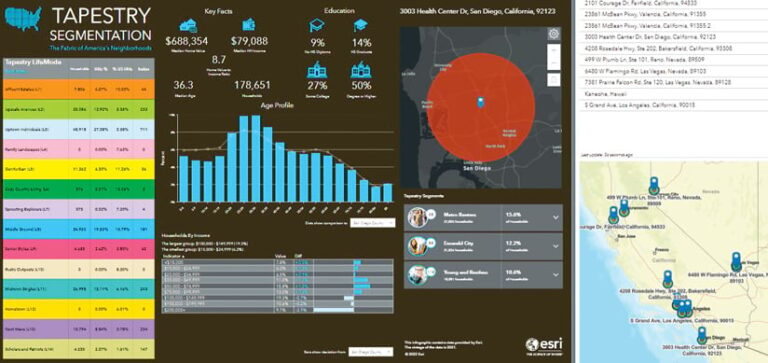
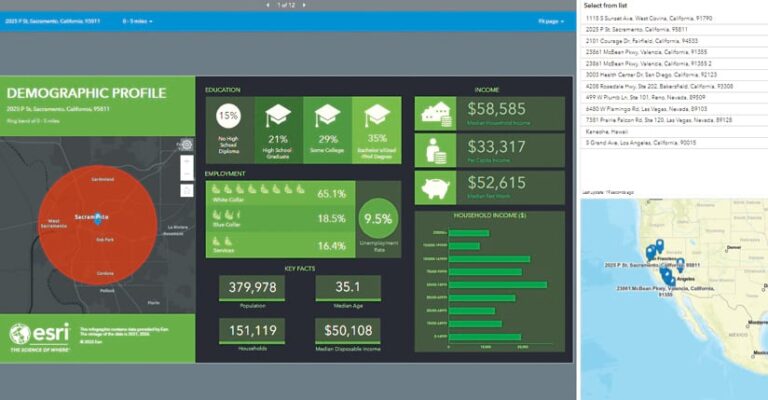
The milk bank incorporated its donor data into ArcGIS Pro and used Business Analyst—a demographic mapping software tool—to layer in additional contextual information, including socioeconomic backgrounds, the locations of current donors, and lifestyle data for past and present donors. The availability of thousands of datasets in Business Analyst has helped the milk bank determine the characteristics and profiles of eligible donors, identify where they are located, and see which areas require prioritized access to breast milk.
After creating maps in ArcGIS Pro, staff members exported the map layers into ArcGIS Business Analyst Web App. This allows the organization to visualize a combination of its existing data and analyze new data added from the web app. For example, staff have organized new and existing variables of data to see comparisons between birth rates in one area and the historical total amount of donated breast milk consumption in that same area. With the analysis results, the milk bank can establish if its current supply will meet anticipated increases in demand. Additionally, the milk bank can locate where outreach to eligible donors is needed the most.
So far, Mothers’ Milk Bank has determined that most donors are between 25 and 35 years old and are in densely populated areas. However, only 2 percent of eligible donors are donating breast milk. With this insight, the organization has modified its marketing messaging to resonate with young women and is targeting local neighborhoods with the highest population rates. In 2022, the milk bank received 18 percent more ounces of donated milk compared to the previous year.
One additional result that the GIS analysis has enabled staff to visualize is how far beyond San Jose’s city limits the milk bank’s reach extends. Throughout 2022, the organization supplied more than 900,000 ounces of breast milk to families in need all over California and across the country.

When the milk bank eventually performs a complete analysis of demographic, socioeconomic, lifestyle, and other types of crucial data, that will help the organization make data-informed decisions about how to adjust its marketing messages to a range of eligible donors. And as the organization’s GIS operations become more robust, Bautista and his team plan to use ArcGIS to map not only San Jose but also other communities in need across the state and, hopefully, the country. Ultimately, they want to establish a precedent for using a geographic lens to track and understand their work so that other organizations within the Human Milk Banking Association of North America can replicate these efforts.
Keeping Up with Changing Circumstances
As the demand for breast milk changes over time, the results of Mothers’ Milk Bank’s data analyses will continue to help answer pressing questions, such as whether families are aware that donated breast milk is available and if breastfeeding parents know that they can donate their breast milk to a family in need. The team will also continue to track where likely donors are located and which areas have the greatest demand.
Staff members at the milk bank are motivated to keep using ArcGIS technology to enhance their data management workflows as well.
“The [staff] is excited and working to pull information from our database with ArcGIS Pro so that it can later be made public to local residents,” said Bautista.
The organization’s GIS work will continue to increase community engagement by educating more people on how to become donors, what it takes to be a donor, and how they can support Mothers’ Milk Bank and even become breast milk donation advocates.

