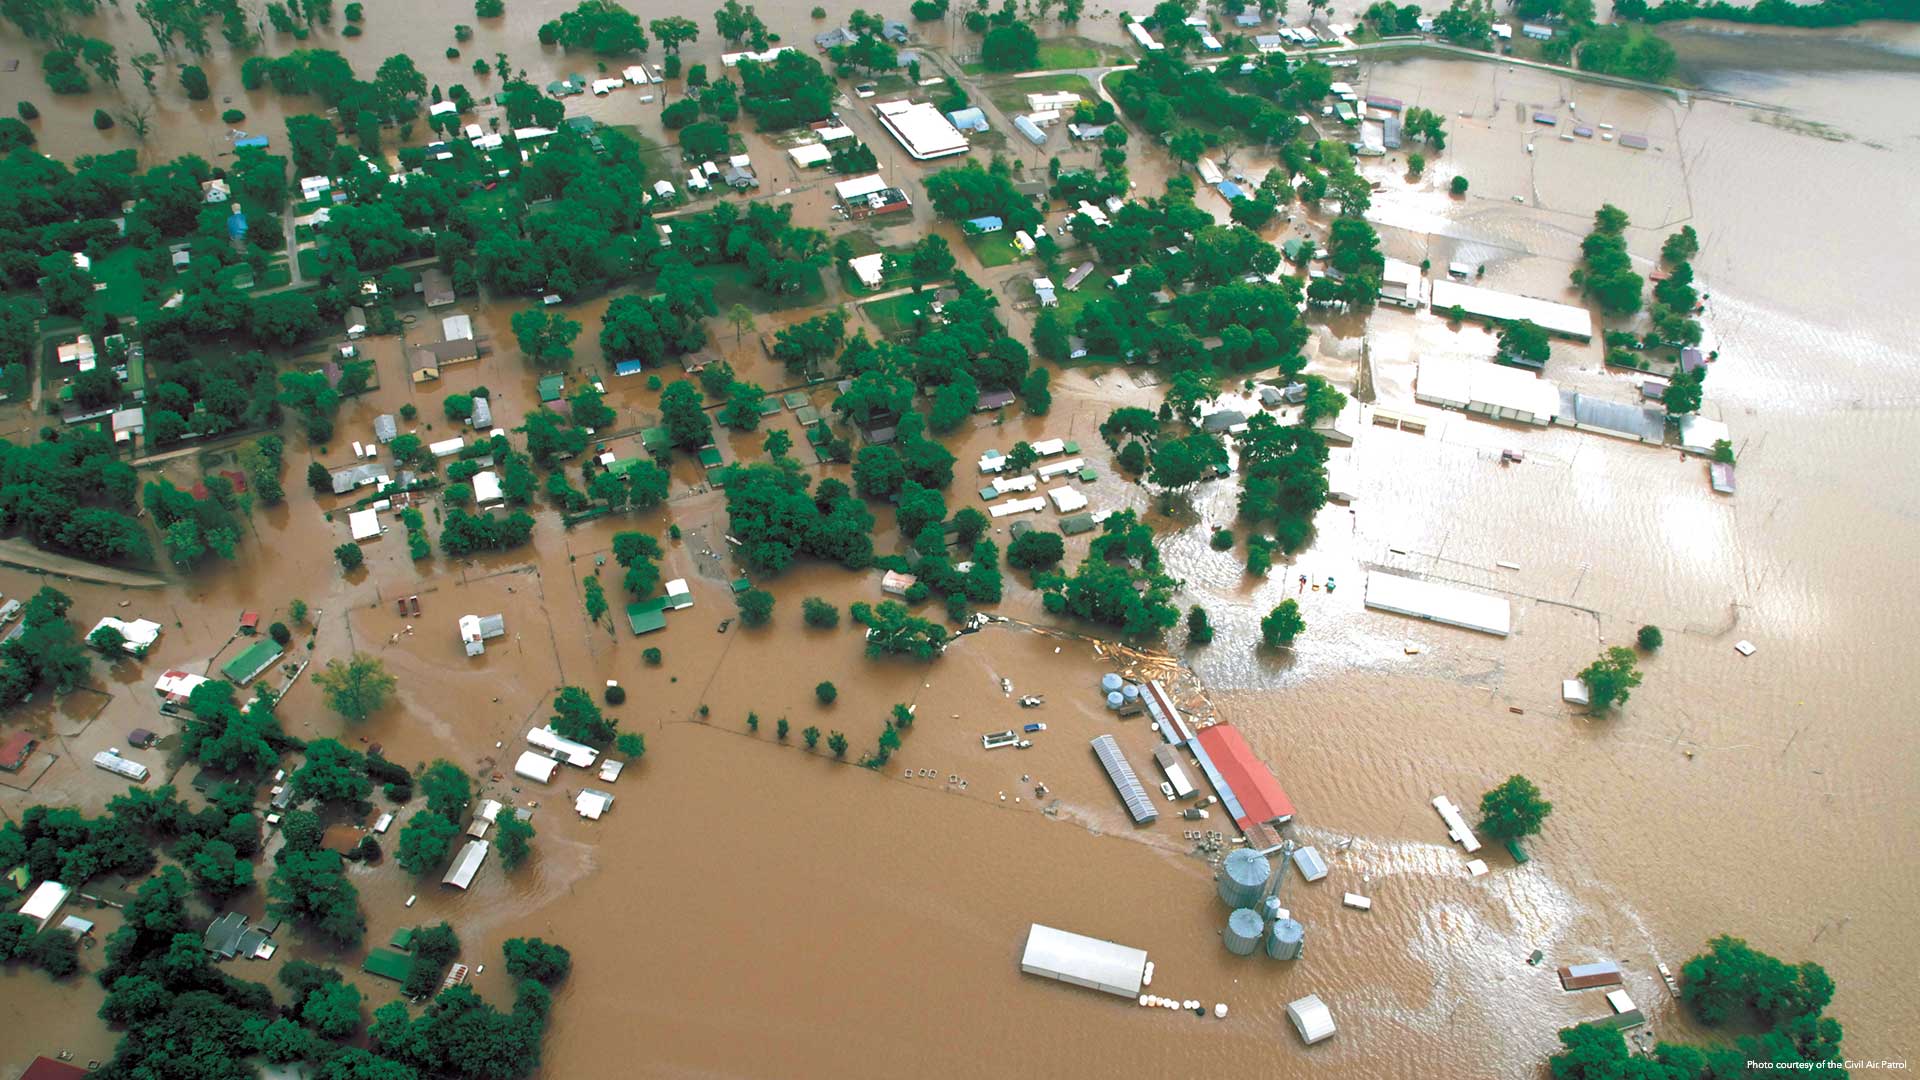
When record-setting rainfall caused historic flooding in the spring of 2019, 27 counties across Oklahoma were declared official disaster areas. Approximately 2,200 homes were damaged as the devastating storm produced water levels that caused reservoirs, lakes, and rivers to overflow.
The Oklahoma Department of Emergency Management (OEM) immediately activated its disaster response and recovery protocol, kick-starting a workflow that begins with recording damage information and concludes with federal assistance being allocated to survivors.

For this disaster, OEM took an innovative approach to this workflow. It crowdsourced damage assessments by having those who were affected by the floods spend less than five minutes completing a simple, web-based form using ArcGIS Survey123.
Now, this mobile GIS solution serves as the centerpiece of a new workflow that’s enabling OEM to speed up the recovery of impacted communities after a major disaster.
A Fast, Scalable Damage Assessment Workflow
When a disaster strikes, OEM oversees a number of critical functions through the State Emergency Operations Center in support of local emergency management officials. The OEM team provides guidance to survivors that need to report any damage to their property, as well as resources to help them file for eligible assistance from the Federal Emergency Management Agency (FEMA). The office also coordinates the delivery of those federal resources to declared disaster areas.
When floodwaters began to overwhelm the state last spring, OEM looked to quickly configure and deploy a fast and scalable damage assessment data workflow. After the team determined the information that needed to be collected, it stood up the Online Damage Reporting survey using Survey123. The information gathered from the survey’s web form would be integral to helping local and state emergency managers better understand the location and extent of flood damage to homes, businesses, and agriculture.
Once completed and ready for launch, OEM promoted its new online damage survey, located on a dedicated state government website through traditional media channels and social media platforms. OEM also included the survey information in its emergency situation updates, which ensured that it was amplified in most local newscasts.
“We did send it to all of our legislators and other stakeholders, so it was being shared very widely throughout the event,” said Keli Cain, OEM’s public information manager. “And of course, since it was a program that was being used statewide in every county that was impacted, it got a lot of play for sure. There was a lot of interest in it.”
Keeping Emergency Managers on the Same Page
After configuring the surveys, the OEM team turned its focus to the second component of the new damage assessment workflow: managing the data that would stream in from those completed surveys. The team chose to use ArcGIS Dashboards for this because of its rapid data aggregation and simple visualizations.
“We have dashboards already that show, basically live, the situation across the data. This made it very easy to integrate this dataset,” said Zach Stanford, the state coordinator for crisis information and disaster intelligence at OEM. “As you see how many incidents you have working, you can also see how many damage assessments or damage reports are pending review. So you can kind of see that workflow as one.”
After the floods, OEM featured the dashboards on displays in the State Emergency Operations Center to easily communicate the current situation. Local emergency managers were also able to access the dashboards, keeping everyone on the same page throughout both the event and the recovery.
Getting Vital Resources to Survivors
Oklahoma residents who were affected by the disaster embraced OEM’s mobile-friendly surveys and new crowdsourcing strategy. For the 2019 floods, the office received approximately 2,600 submissions.

The digital assessment allows survivors to share their unique damage information, upload photos, and pinpoint the location of their property on an interactive map—all using a smartphone or tablet. The ease of using Survey123 enabled OEM to streamline getting preliminary damage assessments (PDAs) to FEMA and the Small Business Administration (SBA). This ultimately resulted in FEMA approving a major disaster declaration for the area and SBA supporting a related low-interest disaster loan program.
“I think the survey gives survivors a step that they can take. It gives them an action that they can do themselves [to try] to receive assistance,” said Stanford. “Rather than being passive and just having to wait for a PDA to happen or a declaration to be approved, they can actually do something on their own behalf to show what the need is in their communities…something that they can do to try to affect their own outcome and recovery.”
Emergency managers have also benefited from OEM’s new standardized best practices for conducting damage assessments. This digital transformation, powered by ArcGIS technology, has completely eliminated the paper-based inefficiencies of not too long ago. Emergency managers no longer have to make educated guesses about what information they need to collect and then travel to every site to manually record their observations.
Instead, OEM now gives local emergency managers access to the dashboards that contain damage assessment data, allowing them to quickly view and analyze the damage assessment forms submitted by impacted residents. From there, emergency managers are able to quickly determine whether further inspection or analysis is required before submitting the full assessment to FEMA for evaluation.
How to Reduce the Next Disaster’s Impact
Currently, OEM is looking ahead and exploring how it can use GIS technology beyond disaster response and recovery.
For example, the office is coming up with ways to offer an open dataset of historical damage assessment reports to researchers and the academic community. The idea is that people in these fields could perform risk analyses and gain a better understanding of how different disasters affect people or infrastructure. This kind of historical context would provide OEM and its partners with new insights into mitigation strategies that drive better preparedness. And it could certainly help reduce the impacts of the next disaster.