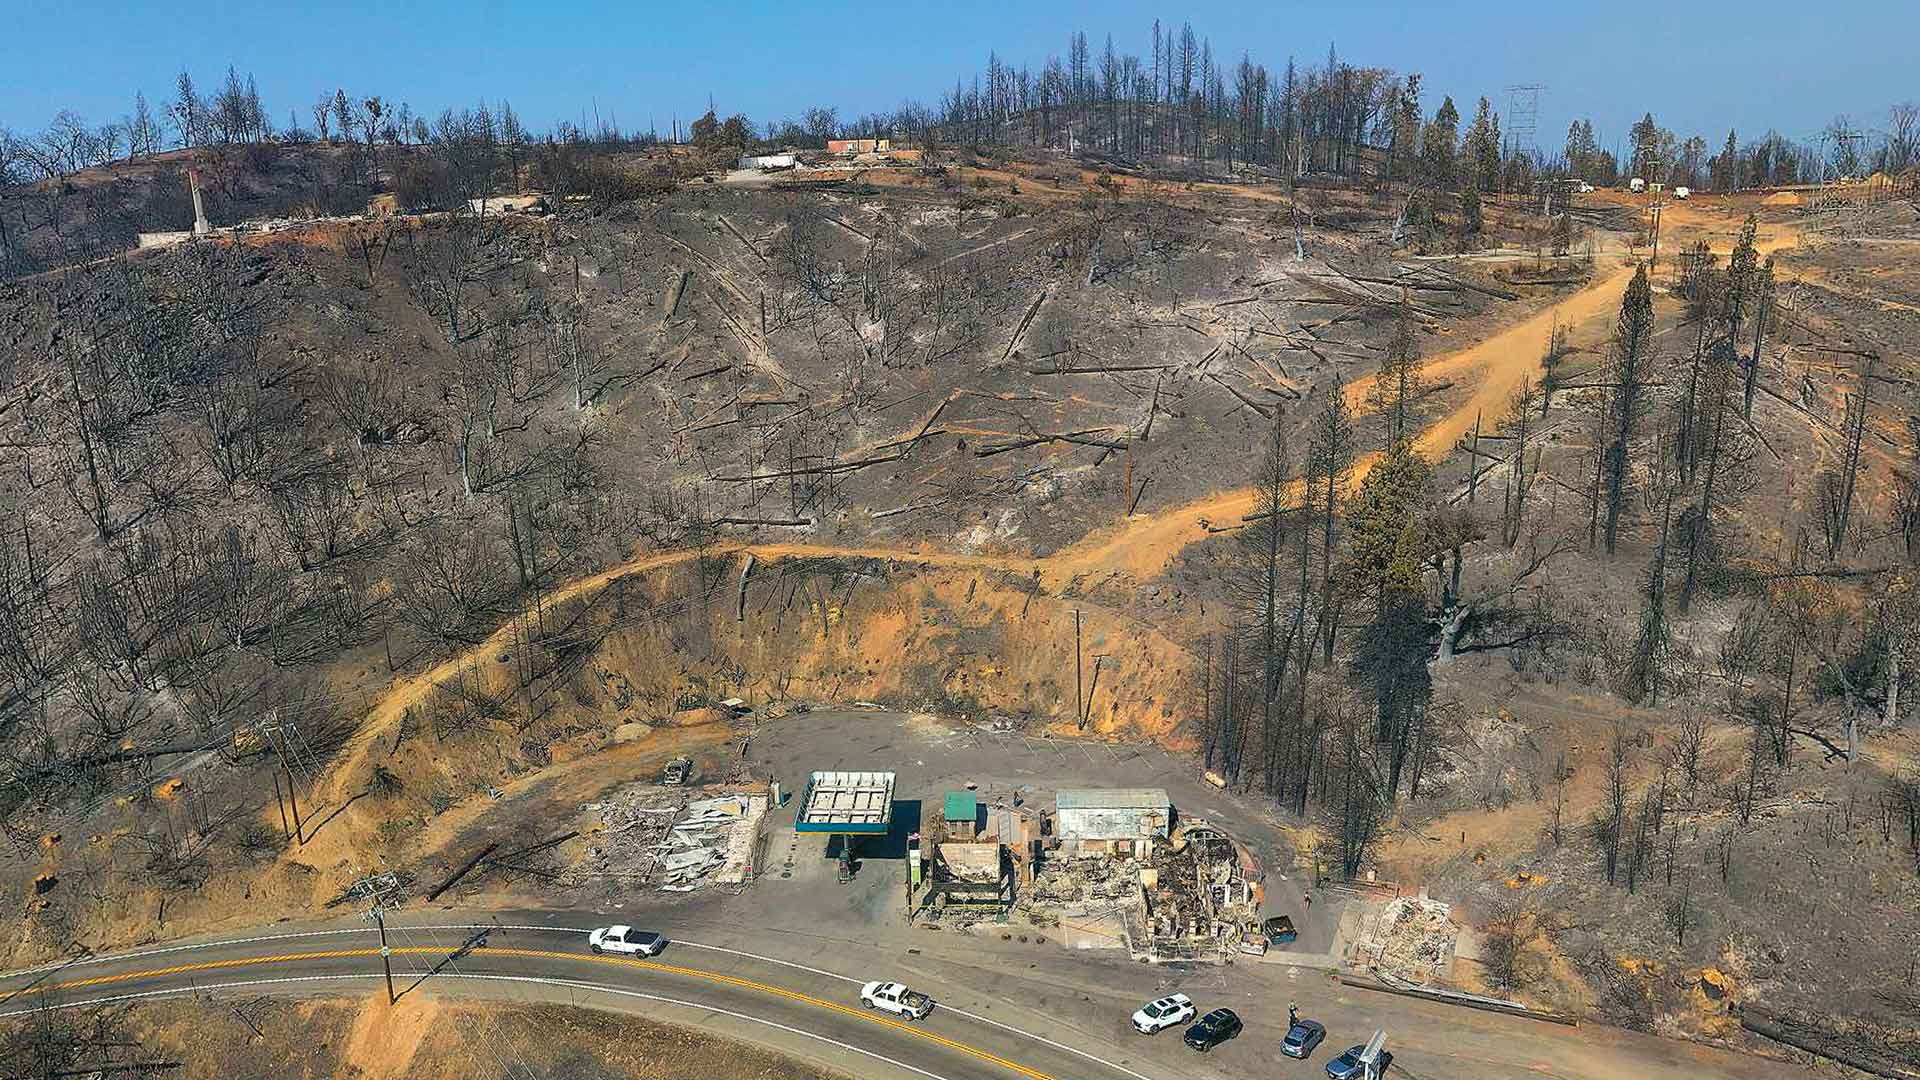
Over the summer, two devastating wildfires in Northern California burned hundreds of thousands of acres, destroying thousands of structures and endangering countless homes and lives. The North Complex Fire that burned in Butte and Plumas Counties and the CZU August Lightning Complex Fires in San Mateo and Santa Cruz Counties were devastating wildfires that required a prompt and organized emergency response from local teams.
To aid in response and damage assessment efforts, law enforcement needed a better way to view these areas. That’s where drones came in. These unmanned aerial systems (UASs) are becoming an increasingly important part of disaster response. They can help with a range of activities, from providing emergency personnel with rapid situational awareness to creating maps of impacted areas.

Law enforcement working on these fires tasked Esri partner and geospatial consulting firm GeoAcuity with obtaining aerial images of the impacted areas by using drones. To furnish multiple agencies and the public with the imagery they needed to conduct fire assessments and boost recovery efforts, the company deployed the cloud-based drone mapping software Site Scan for ArcGIS, along with ArcGIS Online.
“We can show up on-site; throw up a UAS; and within an hour of the flight, have images rapidly processed and into the hands of the people who need [them] most,” said Jason Knowles, CEO and founder of GeoAcuity. “The ability to have current and accurate geospatial information is key to assisting first responders.”
A New Way to Capture, Process, and Share Drone Imagery
Responding to a raging wildfire requires proper planning and efficient management. To make drones a useful part of this process, the team at GeoAcuity needed to first define the areas where imagery had to be captured and then, once the flights were done, manage the imagery data and metadata that would be uploaded to the cloud for processing.
This was not how things have always been done, though. In past attempts to use drones to capture wildfire imagery, response teams defined areas for imagery capture using paper maps; masking tape; and, in at least one case, a yellow crayon. Unsurprisingly, this wasn’t the most efficient method for gathering drone imagery or communicating plans with multiple groups and agencies during an emergency situation.

“There are certainly physical challenges during a wildfire with smoke and visibility, falling trees and power lines, heat, and not [being able to work] together during a global pandemic,” said Greg Crutsinger, director of applied research at GeoAcuity, referring to the COVID-19 pandemic that was also spreading while these fires burned. “Those are enough to try to tackle without worrying about what you are going to do with all this imagery.”
GeoAcuity wanted a new solution that would make it possible to easily define, capture, and process imagery and then share the geospatial data with various emergency response teams. So it chose Site Scan to collect, process, and analyze drone imagery, and ArcGIS Online to plan flights and, ultimately, disseminate relevant information to those involved in fighting the fires.
“Our goal [was] also to be able to share the data as broadly as possible to as many stakeholders as possible…in a way that all the agencies [would] understand,” said Crutsinger.
Tried-and-Trusted Technology Speeds Things Up
GeoAcuity staff members have been Esri users for more than 20 years, so they are familiar with and confident in how Esri products work.
“We can build up [new maps and information products] quickly. We’re functional in the [Esri] environment,” said Knowles.
The first thing the GeoAcuity team did was establish a workflow for capturing data in the field and efficiently communicating it back to the office. For mission planning, the team gave all the drone pilots access to ArcGIS Online to view flight plans and the status of their data capture assignments via their smartphones or tablets. The pilots were also able to use this setup to get instructions on exactly where to fly.
Next, the team used Site Scan to ingest the captured imagery and integrate it into the cloud-based postmission support system. Site Scan allowed the group to process the orthoimagery faster than ever before and publish it directly to ArcGIS Online. Team members then used other Esri products, such as ArcGIS Dashboards and ArcGIS Web AppBuilder, to create dashboards and apps to monitor the project’s status and visualize the resultant data.
According to Crutsinger, GeoAcuity was “processing hundreds of gigabytes [of data] a day and making it public the following day,” delivering completed imagery products within 24 to 48 hours of the drones taking off.
“To be able to pull photos over into ArcGIS Online and just reference [them] to our maps was huge,” Knowles added. “That connectivity and interoperability save massive amounts of time.”
GeoAcuity collected imagery of the burn areas and stitched that into accurate 2D orthomosaics. It also captured 360-degree panoramic views and aerial videos of the fire areas.
For the North Complex Fire, GeoAcuity and the Butte County Sheriff’s Office published high-resolution postfire UAS imagery of about 2,500 acres as 312 individual panoramas and shared them through three public-facing web maps. Deliverables for the CZU August Lightning Complex Fires included high-resolution postfire UAS imagery of 6,000 acres as 650 individual panoramas, shared using two public-facing web maps.
Myriad Stakeholders Benefit from Rapidly Processed Imagery

Law enforcement agencies, emergency response teams, and civilians all reaped benefits from GeoAcuity’s efficient collection and dissemination of geospatially linked drone imagery.
Crucially, GeoAcuity was able to deliver enhanced situational awareness to first responders. More than 30 sheriff’s offices across five counties said they were very impressed with the value that the digital, imagery-based maps brought to their organizations. This helped all the groups involved in fire response and recovery work together.
“The efficacy and timeliness of the imagery…[enhance] situational awareness when [people] physically cannot get to the disaster area,” said Knowles. “It provides a record of the disaster…and helps decision-makers prioritize where to send help and focus rebuilding efforts.”
According to GeoAcuity, its web apps have been viewed more than 90,000 times—and not just by emergency responders. Residents of the area used the free, public-facing resources—including maps with panoramic views and before-and-after swipe maps—to view their homes online and begin to assess possible damages.
“[The number of views] indicates to me a significant value add to the community and first responders,” said Knowles. “Residents can check on their houses when the fire areas are still closed off to the public. We have citizens use the data to help with insurance claims, as well as to support GoFundMe pages using the pre- and postsite imagery.”

GeoAcuity’s efforts have also given affected counties a historical record of high-resolution imagery that they can reference over time. And various agencies and insurance companies have been using the imagery to work together to repopulate areas impacted by the fires.
“I’ve had insurance companies tell me they didn’t need to send a team out [to review a site or claim] because the imagery was good enough,” said Crutsinger.
GeoAcuity can also incorporate other GIS data layers, such as property boundaries and topography, to make the imagery more powerful and deliver information in a standard format that all stakeholders can use. Additionally, using Site Scan to process the imagery enabled the GeoAcuity team to rapidly put the images into an easy-to-consume interactive web map and other apps.
“It’s our job as the subject matter experts to make the end product as elegant and visually compelling [as possible] to tell the story of the disaster. That’s what Esri’s products were built for,” said Crutsinger. “Stakeholders are always amazed at what is produced so quickly.”
An Integrated Workflow Streamlines Response and Recovery
Using Site Scan and other ArcGIS technology, including Dashboards and Web AppBuilder, has given GeoAcuity a full, end-to-end workflow that shapes its strategy, planning, and operational logistics.

“We can now preplan an area [to fly], divide up drone teams, send them out to capture the data, track all of the SD cards [with the raw drone imagery on them] as they come in, process all the imagery, integrate the layers into web maps, and then release those to the agencies and the public,” said Crutsinger.
Employing this integrated workflow, rather than separate tools, for everything from mission planning to stitching together the imagery, undoubtedly helped streamline response and recovery efforts for the North Complex and CZU August Lightning Complex Fires.
“The less time we spend doing debriefings and planning out the missions, the more time we have to collect data, and the more impactful the response will be,” said Knowles. “[The] human impact and devastation [are tough], but it is rewarding [work] because we see how the data we collect and deliver can help make a big difference.”