Each winter in Colorado, avalanches pose a serious risk to residents, visitors, and travelers. Since 1950, they have killed more people in the state than any other natural hazard, and Colorado accounts for a third of all avalanche deaths in the United States. That is why scientists at the Colorado Avalanche Information Center (CAIC) analyze current weather conditions to predict when and where avalanches are most likely to occur, especially along highways. By assigning avalanche danger ratings and issuing warnings, the center helps reduce the chance that people will get injured or killed by avalanches.
During the snow season, CAIC publishes daily avalanche forecasts for Colorado’s backcountry areas to help people plan their winter outings. The center also issues forecasts of the avalanche hazard in transportation corridors for the Colorado Department of Transportation (CDOT) to improve public safety on the state’s highways. Road crews mitigate avalanche risk by using explosives to release any looming packs of snow and then safely clear the debris off highways.
For years, CAIC had been using ArcGIS to map snow avalanche paths as polygons. But scientists thought their GIS had more to offer for database management and prediction. They wanted to make it easier for forecasters to collect data in the field and push it back to a geospatial database so everyone could see and use it almost instantaneously. They also wanted to be able to better visualize where avalanches were happening and why.
Esri partner Earth Analytic, Inc., developed SmartMountain, a set of web-based and mobile apps that allows users to gather, organize, and share data that is critical to keeping snowy environments safe. For about a year now, CAIC and CDOT have been collaboratively using a customized version of the solution to gain a better understanding of how new snow, wind, and persistently weak layers of old snow contribute to the occurrence of avalanches.
“We use the components of SmartMountain that meet our specific needs and modified tools to cover areas much larger than ski resorts,” said Mike Cooperstein, a CAIC avalanche forecaster. “The center’s forecast area includes about 28,000 square miles of backcountry, as well as all the highway passes that avalanche paths cross.”
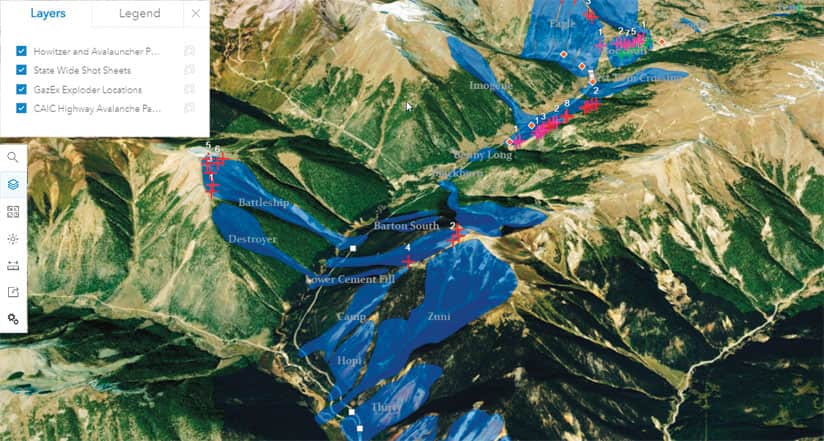
Most of the avalanche hazard mitigation work along Colorado’s highways is carried out by road crews who use explosives to test precarious, snow-laden slopes. Employing Scene Viewer in ArcGIS Pro, forecasters visualize avalanche paths in 3D so they can more accurately recommend where and when to discharge explosives.
With geoprocessing tools, scientists at CAIC can identify the elevation and degree of all the slopes within the surrounding terrain. Once the system processes that data, it outputs feature layers that can be used to display and query the data.
“Our Python machine learning algorithms dig into existing and newly collected field data,” explained Cooperstein. “We can add much more data about the topography of the path and weather conditions that affect each path’s own avalanche behaviors. Machine learning algorithms explore individual path data and calculate predictions.”
The point at which conditions cause an avalanche release is what forecasters call the threshold value. To determine these threshold values, they rely on historic data about each avalanche path and the conditions present when the avalanche occurred. CAIC scientists have written Python scripts to determine threshold values as XML. They then color-code certain avalanche paths that will reach threshold within 12, 24, and 36 hours. Finally, CAIC scientists generate risk-level visualizations and distribute them online to CDOT’s forecasters, who use them to see high-risk areas along Colorado’s highways so they can target their mitigation activities.
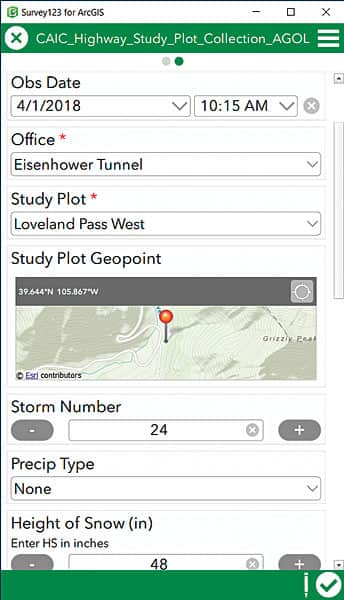
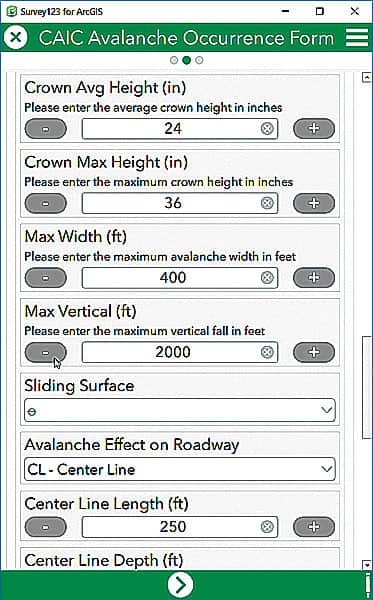
In the past, avalanche forecasters used pencil, paper, and clipboards to record avalanche occurrences. Now, field crews use Survey123 for ArcGIS to collect road closure information and document avalanche mitigation activities. They can record which explosives were used, the results of the detonation, and where an avalanche hit a highway.
“We have also been deciding what questions staff want answered and then building these into GIS applications,” Cooperstein noted. “Forecasters answer their own questions without having to ask a GIS-trained person.”
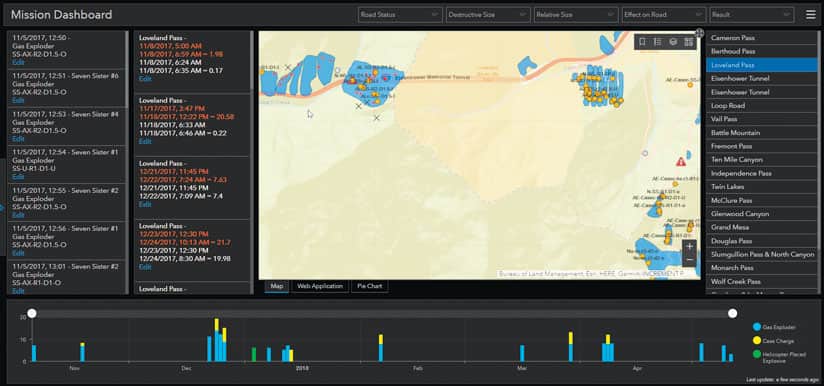
The center also uses Operations Dashboard for ArcGIS to run reports and show avalanche information in real time. The dashboard displays snow and water collection data from each highway pass, as well as several snow study plots. It flags road closures on a map and shows the number of avalanches that hit a highway both while the road is open to travelers and while it’s closed for mitigation. CAIC also maintains a record of explosive inventory numbers, the date and place they were used, and by whom. The dashboard graphs the types of explosives used for avalanche mitigation and shows the outcome. This information is useful for meeting federal and state government reporting requirements.
“In the coming years, GIS will become a very important analysis tool in our industry,” predicted Cooperstein. “The avalanche forecaster community is small and, therefore, able to share innovations that work in our centers. GIS applications for forecasting snow avalanche risk will be commonplace for highway and railway safety.”
For more information, follow @COAvalancheInfo on Twitter and Facebook, or email Cooperstein at mike.cooperstein@state.co.us.
