Microsoft Power BI users now have access to a tool that quickly exposes relationships and patterns, freeing them up to focus on the end results of their analyses and make effective decisions. The new, built-in ArcGIS Maps for Power BI visual lets users of both ArcGIS Online and Microsoft Power BI access their own private ArcGIS basemaps and reference layers directly in Microsoft Power BI.

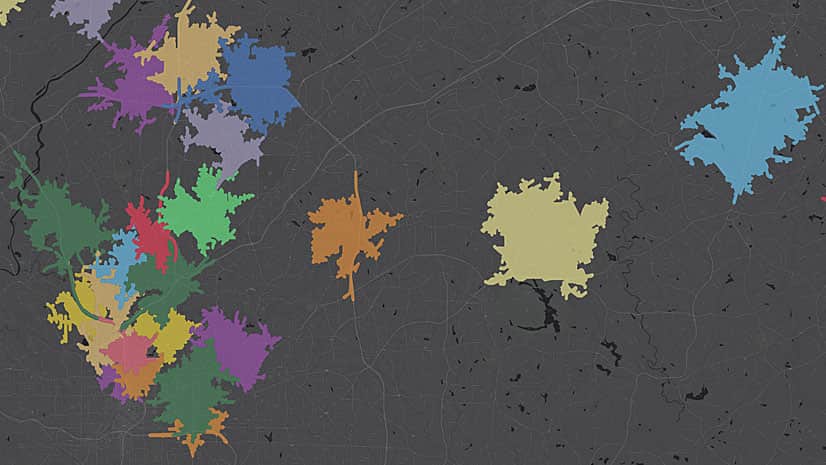
ArcGIS Maps for Power BI makes it easy to create beautiful, accurate map visualizations within Microsoft Power BI. Users can map data from any location value—an address; a city, state, or ZIP code; a place-name or boundary; or latitude and longitude—with a simple drag-and-drop process. Smart mapping defaults guide users to the styles and displays that best fit their data. And users can take advantage of a vast selection of ready-to-use ArcGIS maps and demographic data, as well as simple spatial tools, such as cross-filtering by map selection, heat maps, and drive times.
The new release of ArcGIS Maps for Power BI also allows businesses to purchase Plus subscriptions in one simple transaction and deploy these capabilities across their organizations. Companies can choose from three plans: small for up to 1,000 users, medium for up to 5,000 users, or large for up to 10,000 users.

The Plus subscription for ArcGIS Maps for Power BI, launched in late 2017, gives users access to global demographics, expanded data mapping, and more content from ArcGIS Living Atlas of the World. Plus offerings include the following:
- Verified, curated, and ready-to-use authoritative data
- Premium global demographic data, including age, disposable income, and diversity indexes
- 12 basemaps, including satellite imagery, oceans, and terrain
- The ability to plot up to one million points on a map each month