Understanding the business landscape in a city or town is critical for decision-making in both the private and public sectors. Maybe an area has an abundance of senior living communities but a shortage of essential health-care services. Perhaps there’s an empty storefront in a highly trafficked area, and there’s an opportunity for a local business to open another location. Knowledge like this shapes business strategies. When business owners and government departments have access to business data, it can help them identify market gaps, validate expansion opportunities, and evaluate where to invest in infrastructure or services.
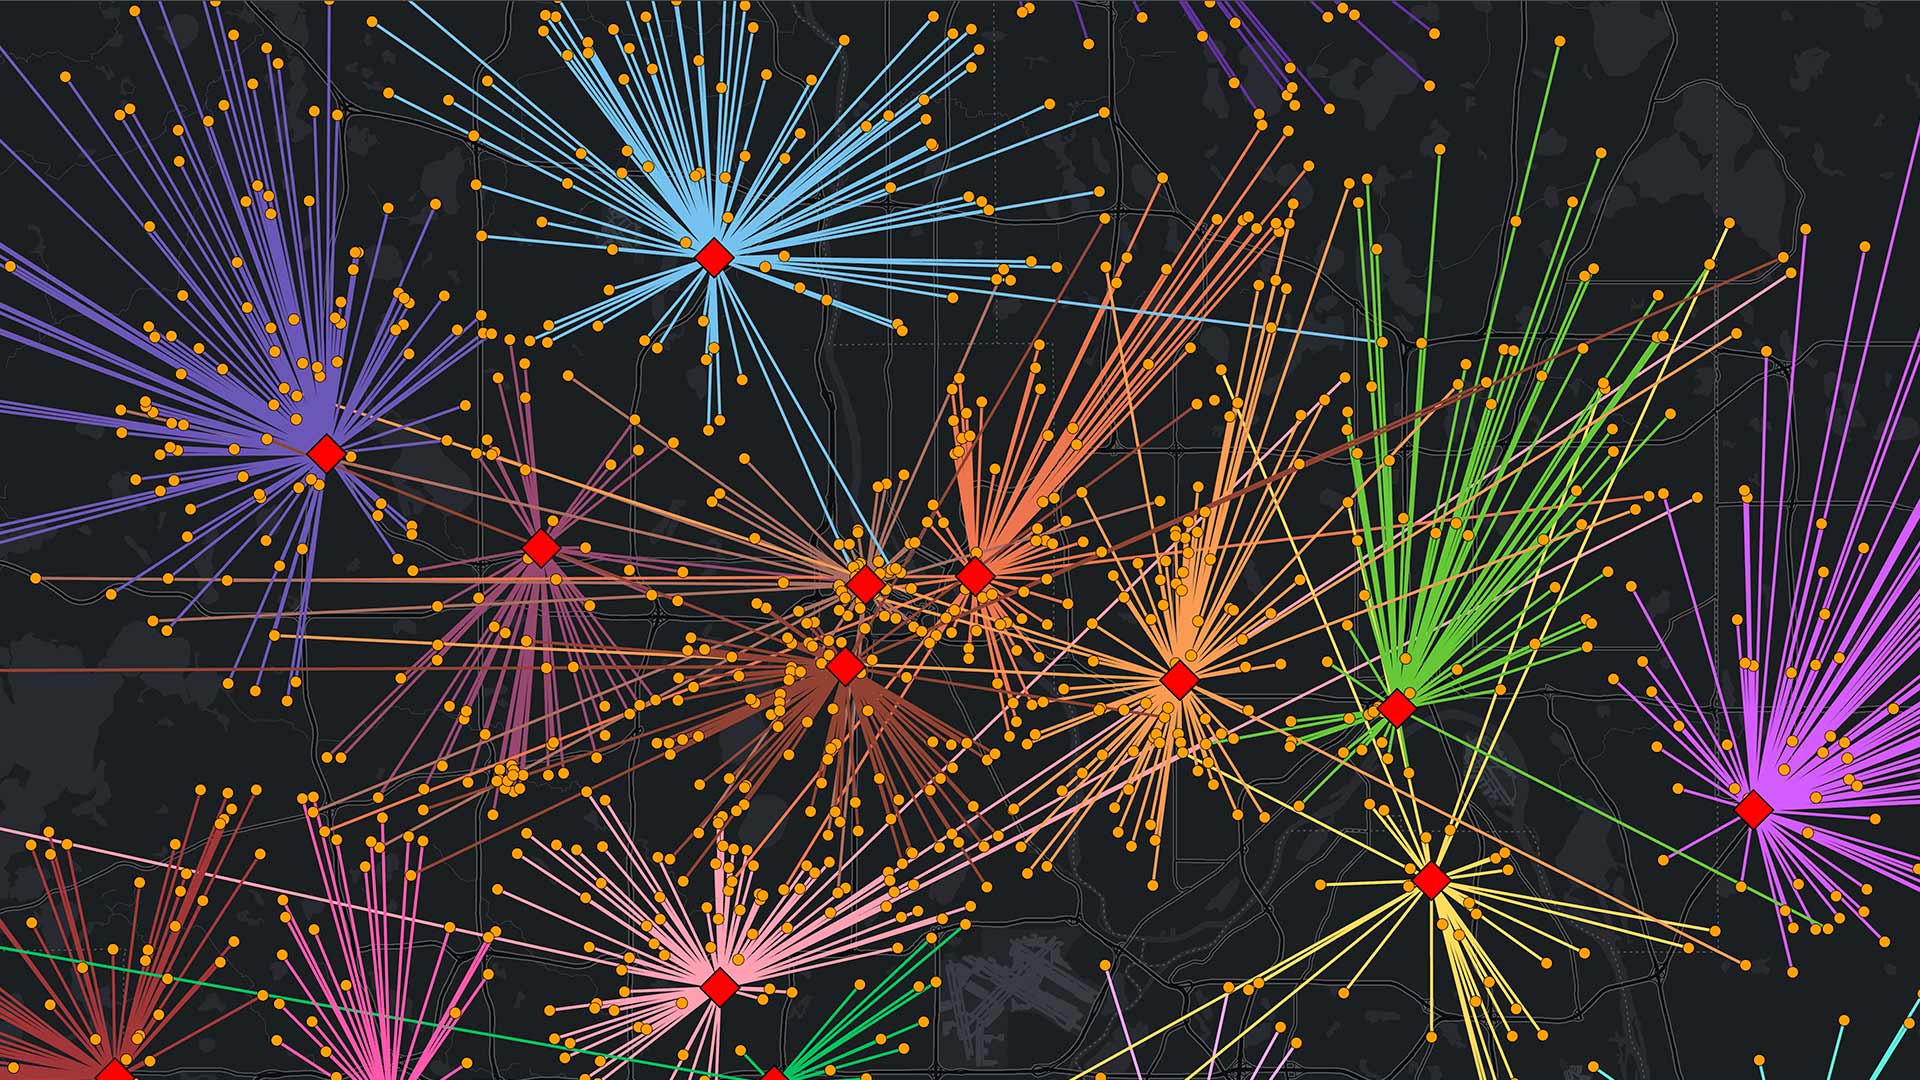
Esri partner Data Axle supplies rich business information for the United States and Canada to ArcGIS Places, Esri’s business-focused points of interest (POI) dataset that powers the ArcGIS Business Analyst group of products, including ArcGIS Business Analyst Pro, ArcGIS Business Analyst Enterprise, ArcGIS Business Analyst Web App, and ArcGIS Business Analyst Mobile App. The dataset features more than 14 million verified business records for the United States and Canada and includes valuable business-focused information such as employee and sales volume counts, business descriptions from the North American Industry Classification System (NAICS), and specialty information.
Read on to find out how various sectors can use Data Axle’s business information in the POI search in Business Analyst.

Granular Business Data Promotes Rich Insight
Data Axle’s business data goes beyond mapping business addresses. Each record includes business-type classifications—independent, branch, headquarters, or kiosk—plus estimated employee counts.
Business-type classifications can help economic development teams provide targeted support for independent businesses. For example, if a county is launching a grant program for independent businesses with 10 or fewer employees, county staff can use Business Analyst to filter by employee count and business type, then visualize concentrations of these types of businesses using heat maps to guide outreach and engagement.
Points also show layered activity on a single property—like when there’s a coffee shop inside a grocery market or a pharmacy inside a general merchandise store. This granularity supports richer local business insights, including opportunities for strategic partnerships and increased brand visibility.
Retail and Real Estate:
Conduct Highly Specific Searches
The new Nearby Analysis workflow in Business Analyst Web App allows users to quickly look at key measures, like store counts and concentrations of businesses, and compare these between different areas.

Retailers can leverage this workflow to assess development opportunities by analyzing proximity to anchor businesses—such as big-box retailers or entertainment venues—that drive foot traffic to nearby stores. Quick-service restaurant chains, for example, can evaluate competitive density within defined drive-time areas, uncover underserved markets, and combine demographic data with business intelligence to target expansion in areas with high potential.
Data Axle also provides proprietary eight-digit NAICS codes and specialty tags that enable highly specific searches. Instead of performing a search for “restaurants,” users can employ filters like “full-service breakfast” or “Asian fusion” to pinpoint exact competitors. Retailers and real estate developers can perform site selection based on surrounding businesses, identify complementary businesses for mixed-use projects, and find secondary business types such as fitness centers that have a juice bar.
By combining detailed business classification, location intelligence, and visualization tools, this dataset empowers decision-makers to identify high-potential areas, streamline market analysis, and optimize growth strategies.
Health and Human Services:
Analyze Health-Care Availability Against Need
In today’s evolving health-care landscape, understanding health-care facility locations within a community is critical for effective planning and research. Data Axle business listings cover facilities that range from major hospitals to assisted-living centers. They’re also tagged with rich specialty information, such as “pediatrician” or “optometrist,” to help with detailed analysis.

In Business Analyst, users can analyze these health-care facilities against critical demographic variables such as age, household size, income, and insurance status. For example, planners can map where senior populations live and compare that to existing facilities to pinpoint gaps in access. Similarly, hospital networks might discover that rural residents face long drives to the nearest urgent care. By layering POI data with household income and insurance coverage information, planners can prioritize where to open satellite clinics to expand their reach to economically vulnerable populations.
This data-driven approach enables hospitals, urgent care facilities, and senior-care providers to address service discrepancies, strategically expand, and deliver care where it is needed most.
Disaster Preparedness and Response:
Plan for Populations That Need Help During Extreme Weather Events
Natural hazards such as floods, storms, and fires can cause costly damage and disrupt essential services like grocery stores and gas stations, leaving communities without access to food, medicine, and fuel. Understanding where these vulnerabilities exist is critical for decision-makers. Business location data, coupled with environment and natural resources layers from ArcGIS Living Atlas of the World, can help conduct this important analysis.
Drought intensity, flood hazard areas, and storm reports layers—all available in ArcGIS Living Atlas—reveal zones that are at high risk of damage from natural hazards. When used in concert with Data Axle’s business location data, users can see which hospitals, assisted-living facilities, fuel stations, and grocery stores lie within these zones.

This gives local decision-makers a good idea of which populations may need extra support during weather events. Government agencies can identify where to make infrastructure improvements, emergency managers can pinpoint resource gaps, nonprofits and community groups can target outreach and preparedness efforts, and businesses can evaluate the risks for current and future operations.
Government and Public Works:
Model and Analyze Community Needs
Government agencies—from transportation departments to economic development offices—rely on POI data to address diverse needs. They use it to model travel demand, identify food deserts, look up critical infrastructure, and streamline tax and revenue operations.
With POI data, agencies can conduct predictive analyses, such as benchmark comparisons or suitability reviews, to identify optimal locations for public facilities including libraries, parks, and community centers. They can also analyze the population’s ability to access essential services like public transit, health care, and grocery stores.
POI data empowers government agencies to make informed, location-based decisions that improve service delivery, optimize resource allocation, and enhance residents’ quality of life.

Geographic Patterns Influence the Real World
In an increasingly data-driven world, location intelligence has become fundamental to robust decision-making across every sector. By integrating Data Axle’s in-depth business data with ArcGIS Business Analyst, users can move beyond surface-level analysis and uncover the geographic patterns that drive real-world outcomes.
Whether identifying underserved communities, mitigating disaster risks, optimizing retail site selection, or planning essential public services, combining authoritative business location data with rich demographic and geographic context can transform how organizations understand and respond to the needs of the populations they serve. By leveraging these powerful analytical tools, leaders can make more informed, strategic decisions that not only drive business success but also enhance community resilience, improve access to critical services, and contribute to an area’s economic vitality.