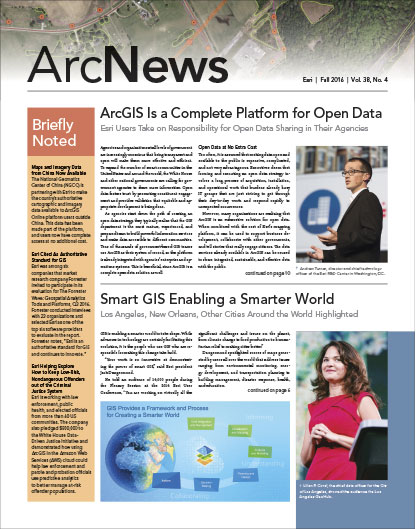
Los Angeles, New Orleans, Other Cities Around the World Highlighted
GIS is enabling a smarter world to take shape. While advances in technology are certainly facilitating this evolution, it is the people who use GIS who are responsible for making this change take hold.
“Your work is so innovative at demonstrating the power of smart GIS,” said Esri president Jack Dangermond.
He told an audience of 16,000 people during the Plenary Session at the 2016 Esri User Conference, “You are working on virtually all the significant challenges and issues on the planet, from climate change to food production to humanitarian relief to making cities better.”
Dangermond spotlighted scores of maps generated by users all over the world that address issues ranging from environmental monitoring, energy development, and transportation planning to building management, disaster response, health, and education.
“GIS and maps are the common language that brings us together: they help us communicate, they help us understand, and they will help us act,” he said. “You are addressing so many of our planet’s increasing challenges,” from loss of nature and lacking biodiversity to ongoing social conflict.

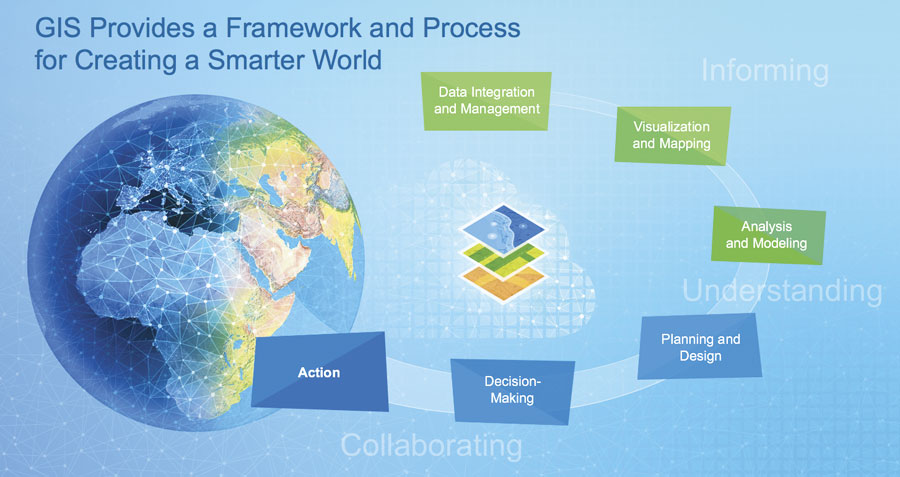
“GIS—your profession, your technology—provides the framework and the process for creating…a smarter world,” asserted Dangermond.
With its ability to integrate and manage data, GIS transforms abstract information into visual models—maps, charts, and 3D representations—that are increasingly informing people and organizations all over the world. The technology integrates content and provides the context for understanding why things are the way they are, allowing anyone who uses GIS to analyze the interrelationships among various phenomena. By using this technology to connect and collaborate, people and organizations can gain a better understanding of the forces that shape the world we live in today, with the goal of discovering and designing better paths toward a more sustainable future.
GIS is undergoing a transformation as well. With the Internet of Things (IoT) promising to measure in real time virtually everything that changes or moves, a massive digital transformation is under way. Enormous amounts of data are now becoming more widely available, and maps have the ability to not only visualize this information but also integrate data from many sources and communicate this information to people and organizations.
Bringing Together Disconnected Data
“Smart GIS…is about integrating everything—connecting people and processes and things and all the data about them,” noted Dangermond. “Smart GIS, for me, also means being able to engage communities.”
This, in fact, is what the City of Los Angeles, California, is doing with its Los Angeles GeoHub, which brings together disparate data that, until now, has been stored in different city departments. The online public platform encourages residents to use this data and the ready-to-use apps available at the GeoHub to improve their city.
“The citizens of Los Angeles and the employees are basically weaving together pockets of our GIS data and technology that have been hidden in the halls of our city,” said Lilian P. Coral, chief data officer for the Office of Mayor Eric Garcetti in the City of Los Angeles. “What this has meant is that we’ve been developing applications that matter and we’re putting data to work.”
For example, GeoHub is being used to inform initiatives such as Vision Zero, which aims to lower the number of deaths and serious injuries caused by traffic collisions. And the city’s Street Wize app uses Web GIS to pool data onto a single map so that citizens can see in-progress or upcoming construction work on their streets. Private developers can use Street Wize to examine building opportunities as well, and the city uses the app to minimize construction conflicts and encourage coordination.
“The GeoHub dynamically integrates real-time data onto this user-focused map,” added Coral. “And now we can use the same data and actually feed it into other applications—say, for emergency management.”
As Los Angeles mayor Eric Garcetti specified, “[The] portal enables us to reinvent the way we’re delivering services and broadens our ability to engage everyday residents and businesses.”

Surveying Blight in the Big Easy
The City of New Orleans, Louisiana, is conducting similarly engaging projects, though with a bit of its own flair. In an effort to be extremely thoughtful about how the water-bound city uses its land, New Orleans—together with the community—built a map that uses soil permeability, wetlands, and historical flood zones to show areas where the ground is highly absorbent and likely not ideal for development.
“Using this map, we can think in completely different ways about how we build our environment and our neighborhoods,” said Lamar Gardere, the city’s chief information officer.
Gardere also exhibited the city’s BlightStatus crowdsourcing web app, which in addition to educating residents about the blight remediation process also enlists citizens to report blight.
After collecting street-level photos of every parcel in New Orleans, the city created a six-question survey that people can use to determine blight on individual properties. Having members of the community use the photos to report whether or not there is a structure on the property; if the lot is overgrown; and if the walls, doors, or roof appear to be damaged allows the city and citizens to get a better idea of where blight is occurring around New Orleans and what needs to be done to restore these areas.
“Running frequent surveys will give us a reliable layer of vacant lots and foundation type, giving us a sense of our housing resiliency,” said Gregory Hymel, the GIS director for the City of New Orleans.
As he pointed out, having a baseline on blight before hurricane season helps New Orleans tremendously with recovery efforts.

Insuring a Smarter Future
Knowing how natural disasters could affect various areas is at the core of what companies like Guy Carpenter do. One of the world’s largest reinsurance brokers, Guy Carpenter helps its customers—insurance companies—manage claims and assess risk. And it uses GIS to do so.
For example, Guy Carpenter used ArcGIS to visualize which neighborhoods were impacted by a massive wildfire in Fort McMurray, Alberta, Canada, earlier this year. The fire destroyed about 2,400 homes and buildings and forced more than 80,000 people to evacuate.
“We could…pinpoint individual homes destroyed by the fire,” said Shannon Peterson, a product manager for Guy Carpenter. “With this information, insurance companies can focus in on the homes that they insure, estimate their losses, prepare for expected claims, and put the resources in place to assist their policyholders.”
Guy Carpenter also provides clients with a catalog of historic, mapped data that goes back 60 years and shows the relative risk of natural disasters such as tornadoes throughout the United States.
“In states where tornadoes are prevalent, insurance companies need to balance a mix of locations [for policies]they have across these high- and lower-risk areas,” said Peterson.
The company also has a web-based risk management app called GC AdvantagePoint that uses ArcGIS to tackle clusters of risk.
“Bringing together the power of GIS and our industry knowledge…we help our clients manage a concentration of risk through stunning visualization and powerful analytics,” said Bryan Adams, senior GIS specialist at Guy Carpenter.
Peterson added that insurance companies also use the app to evaluate locations before underwriting new policies.
“Underwriters are able to see the concentration of other homes they already write in that area,” she said. “Underwriters can also evaluate hazards around the location like terrorism targets, distance to [the] coast, distance to fault lines, and other hazards as customized by the insurance company.”
Insurance companies that use GC AdvantagePoint can even get live data feeds to real-time information, such as wildfire perimeters, so they can monitor situations that might affect their policyholders.

A Humboldtian View of Nature
Although nature can be vexing to insurance companies, it was what motivated and inspired Alexander von Humboldt. The Prussian scientist and naturalist spent his life in the eighteenth and nineteenth centuries studying and writing about nature. He explored South America and Russia, observing a diversity of plants, animals, and geology.
Andrea Wulf’s book, The Invention of Nature: Alexander von Humboldt’s New World, explores Humboldt’s views of nature “as a web of life.” She said one of his goals was to excite in people a love of nature.
Humboldt’s writings—including his seminal book Cosmos: A Sketch of the Physical Description of the Universe—greatly influenced a number of prominent naturalists, politicians, writers, and thinkers, including Charles Darwin, Henry David Thoreau, and John Muir, Wulf said. The maps and infographics in these books, which accompany essays about science and nature, were pioneering, foreshadowing what we know today as GIS.
Wulf showed examples of Humboldt’s maps, including one that focused on the transportation of precious metals around the world. Another showed the location of volcanoes and earthquakes, with green circles illustrating groups of volcanoes; green and red dots showing inactive and active volcanoes, respectively; and gray shaded areas displaying where earthquakes had occurred.
“[Humboldt] was…the founder of what you are doing here today,” Wulf said. “He said that with knowledge comes thought and with thought comes power. So his belief in the free exchange of information, in uniting scientists, in fostering communication across disciplines remains an important pillar of science and communities today. And this is exactly what you are doing here. You are sharing all your knowledge, all your data with your Web GIS.”

Embracing Understanding
Just as Humboldt cultivated and shared his knowledge, so should GIS practitioners.
“Geography, mapping, [and] GIS have never been so important,” said Dangermond. They provide “the language of understanding of our world and…a platform for creating a better future.”
With GIS continually getting smarter, humans today are aware of things they couldn’t have known before—things about the built environment, about nature, about the planet. That engenders a different kind of understanding about the world—and that is just what Richard Saul Wurman, founder of TED Talks, wanted the audience to contemplate at the end of the Plenary Session.
“I’d like you to think about how you personally understand things,” he prompted. “Don’t measure yourself by what teachers or parents or others tell you…that this is the only way you can do things.”
Instead, he urged attendees to figure out how they each go about understanding things. It will be different from person to person, he said, but he gave everyone “permission…to embrace that idiosyncratic, human way each of us understands things.”
Because, just as GIS cultivates new understanding, so do different ways of understanding create a better, smarter world.