On January 24, 2019, hundreds of volunteers arrived before dawn at deployment centers across San Bernardino County to get their assignments. Donning orange vests and carrying bags of supplies, they set out to walk city streets.
Across the United States that day, volunteer crews convened to do the same thing: count the homeless population. But this year was different in San Bernardino County, California. For the first time ever, the county used mapping technology to plan, execute, and analyze the results of the count. This meant that volunteers just needed their smartphones to do their work. And it gave the County of San Bernardino a much better understanding of its homeless population.

As the results poured in, what was once just numbers on a spreadsheet became a living map. This time, each person experiencing homelessness was not just counted but was seen.
Making This Year’s Point-in-Time Count More Efficient
Currently, local governments are having to ask difficult questions about homelessness. The homeless population is growing across the United States, which poses many risks to the individuals experiencing homelessness and puts added strain on communities. Local governments are looking toward new solutions that can help address homelessness from a data-driven perspective.
That is where homeless population counts come in. While there is a long-standing debate over the best way to count the number of people experiencing homelessness, point-in-time counts (PITCs) are commonly used both in the United States and internationally.
To conduct a PITC, groups of volunteers go out on a single day and interview people experiencing homelessness to get an understanding of demographics and total population numbers. The information garnered through these counts is crucial to providing resources to homeless populations and targeting the right communities for interventions. Time, however, is a limiting factor for volunteers.
Over the past year, the San Bernardino County Sheriff’s Homeless Outreach and Proactive Enforcement (HOPE) team has been using Esri’s Survey123 for ArcGIS app to map and record all their interactions with people experiencing homelessness. This information gives the sheriff’s department and, thus, the county a historic account of where homeless people are congregating.
For this year’s PITC, that data from the HOPE team was used to tell volunteers where to go. This helped ensure that volunteers used their time efficiently by covering areas where they were most likely to be effective.
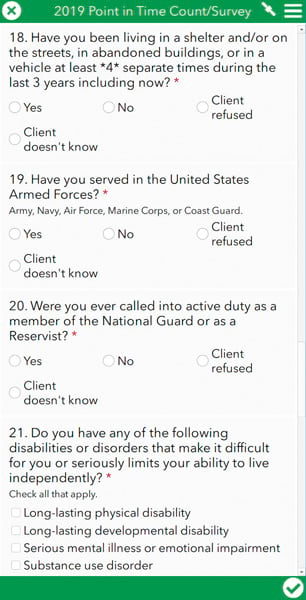
After conducting a successful pilot program with Survey123 in 2018, the County of San Bernardino adopted the app for the 2019 PITC. Rather than using paper surveys, as they’d done in the past, volunteers for the 2019 PITC went out into the field equipped with Survey123 on their mobile devices. The count’s stakeholders were then able to monitor progress in near real time and dive into the results instantly using ArcGIS Online.
An Earlier Look at Numbers and Patterns
The benefits of using the ArcGIS platform were immediately evident to the count’s volunteers, as well as project leaders and stakeholders.
For the volunteers, the survey form in Survey123 was configured with conditional logic to only display relevant questions. When interviewees indicated that they had slept in a vehicle, for instance, follow-up questions about what type of vehicle and how many people had slept in it would appear next. This conditional logic drastically simplified the users’ experience, allowing them to quickly conduct the survey from top to bottom without having to skip questions. This got overwhelmingly positive feedback from the count’s volunteers, who found the new survey easier and faster to use.

The use of [ArcGIS technology] gives us a more realistic sense of the growing problem we are facing, making the 2019 point-in-time count numbers the most accurate to date.
As volunteers conducted each interview, Survey123 also did several calculations behind the scenes. For example, establishing whether an individual is experiencing chronic homelessness according to the definition specified by the United States Department of Housing and Urban Development (HUD) requires working out a relatively complicated formula that, in years past, had to be calculated in the weeks after the count. Using Survey123, however, made it possible for the calculation to be done on the fly, allowing stakeholders to get a much earlier look at the numbers than had previously been possible.
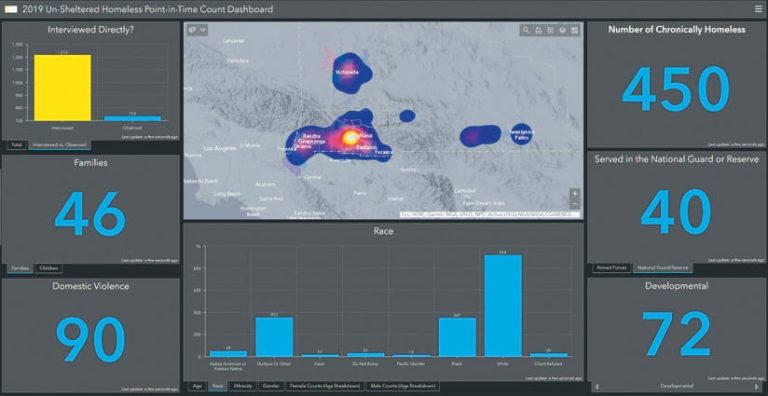
Completed surveys were written directly to the Esri Geospatial Cloud via ArcGIS Online, which not only helped maintain the integrity of the data but also made it immediately available to stakeholders. On the day of the count, project leaders were gathered in a command center equipped with a dashboard built using Operations Dashboard for ArcGIS. This dashboard displayed up-to-the-minute information from surveys being submitted from the field. Leveraging the dashboard in the command center enabled stakeholders to monitor the progress of the count and get an early glimpse at the data. Neither had been possible when paper surveys were used.
Another benefit to project leaders and stakeholders was that Survey123 leveraged the GPS location of each volunteer’s device, providing far greater insight into geographic patterns in homelessness than ever before. Whereas in past years it was only possible to know how many people experiencing homelessness had been surveyed in each community, this year, staff at the County of San Bernardino were also able to see precisely where the surveys were conducted, which can help target assistance programs more effectively.

Less than 24 hours after the count was completed, stakeholders from the county’s Homeless Partnership, Board of Supervisors, and Information Services Department gathered in a conference room and used a configuration of Web AppBuilder for ArcGIS to explore the count’s data. By applying a sequence of filters, they were able to get a breakdown of numbers and locations where certain populations of interest—such as chronically homeless veterans or women with children who reported fleeing domestic violence—had been encountered and interviewed. Stakeholders also used a web mapping app to overlay data from the PITC with data from the HOPE team to identify areas where the HOPE team had historical contact with the homeless community but that had not been canvassed by PITC volunteers. This allowed the sheriff’s department to deploy the HOPE team the following week to canvass these areas and help ensure that the PITC was as complete as possible.
Standardized Data Collection Will Help Future Counts
The County of San Bernardino’s 2019 PITC is believed to be the most precise count conducted yet, thanks to the ArcGIS platform.
“The use of [ArcGIS technology] gives us a more realistic sense of the growing problem we are facing, making the 2019 point-in-time count numbers the most accurate to date,” said Josie Gonzales, vice chair of the San Bernardino County Board of Supervisors.
Looking forward, the county plans to continue using Survey123 for subsequent PITCs, which will standardize data collection from year to year. In the future, it will be possible to compare data through the years to evaluate how patterns in homelessness change over time, as well as how those patterns relate to the county’s outreach efforts and availability of services.
To learn about how ArcGIS technology can help communities gain a better understanding of homelessness, explore the Reduce Homelessness web page from the ArcGIS Solutions for Local Government team. For more information on how the County of San Bernardino leveraged GIS for the 2019 PITC, email GIS business systems analyst Lindsay King at lindsay.king@isd.sbcounty.gov.


