According to the Centers for Disease Control and Prevention (CDC), nearly 71,000 overdose deaths in the United States in 2019 involved opioids. In addition, the economic burden of the opioid crisis—including health-care and treatment costs, lost productivity, and criminal justice involvement—totals $78.5 billion per year.
Fortunately, overdose treatments are effective—particularly naloxone, a medication that quickly reverses the effects of opioids. Naloxone is easy to administer and has been used for many years as an immediate treatment for opioid overdoses. Distribution programs for naloxone, which train nonmedical persons to recognize opioid overdoses and administer the medication, have been around since the 1990s. And more recently, a widely adopted “leave behind” program expanded access to naloxone by having emergency medical services (EMS) personnel who respond to an opioid overdose leave behind a naloxone kit with friends or relatives in case the person overdoses again.
, latex gloves, a brochure, and a business card")
In Hamilton County, Tennessee, approximately 106 people died from overdoses and other drug-related issues in 2019, and that number increased by 50 percent in 2020 to about 160, according to the medical examiner (ME). Law enforcement agencies across the county responded to more than 700 overdose incidents in 2020, per the Tennessee Bureau of Investigation, and 90–95 percent of those calls likely involved opioids.
The rise in opioid overdoses prompted area health organizations to search for a way to get the state’s first leave behind program for naloxone up and running. Using GIS, a research team at the University of Tennessee at Chattanooga (UTC) and its Interdisciplinary Geospatial Technology Lab (IGTLab) analyzed opioid overdose trends in Hamilton County and determined the most effective way to distribute naloxone kits among local EMS stations.
Identifying Clusters of Overdoses
The IGTLab, run by UTC GIS director Charlie Mix, provides spatial data analysis and cartographic support to UTC faculty, staff, and students and the greater Chattanooga community. It also gives students unique learning opportunities that help them hone their GIS skills on real-world problems while supporting local nonprofits and other organizations.
“Over the years, the lab has provided GIS support in areas including conservation, outdoor recreation, and public health,” said Mix.
It was 2018 when the IGTLab was approached by a coalition composed of the University of Tennessee Health Science Center, Erlanger Health System, and the University of Tennessee at Chattanooga to help develop solutions to the area’s opioid problem. The group had a limited supply of naloxone kits and wanted to come up with spatially based criteria for allocating them.

Mix and UTC GIS analyst Nyssa Hunt used ArcGIS Pro, ArcGIS Online, and ArcGIS Insights to conduct the spatial analysis. They obtained two years of tabular EMS response and ME reports for opioid overdoses, which were scrubbed of personally identifiable information, from researchers in the coalition.
To geocode the data, team members used the ArcGIS World Geocoding Service. They did the EMS data separately from the ME data, since they were in different schemas. Duplicate records in the datasets were identified and removed.
The EMS data and the ME data were then combined in ArcGIS Pro using the Merge tool, and data schema differences were reconciled using the Field Map parameter. This workflow resulted in three separate opioid overdose point datasets that were suitable for analysis: EMS data, ME data, and EMS and ME data combined.
The team then used the geoprocessing tool Optimized Hot Spot Analysis in ArcGIS Pro to identify spatial clusters of opioid overdoses for all three datasets. These represented areas in the county with the most overdoses over the study period, which was two years.
“This allowed [for] the easy identification of areas in the county with the most overdoses reflected by the data,” said Mix.
Recognizing Patterns of Opioid-Related Deaths
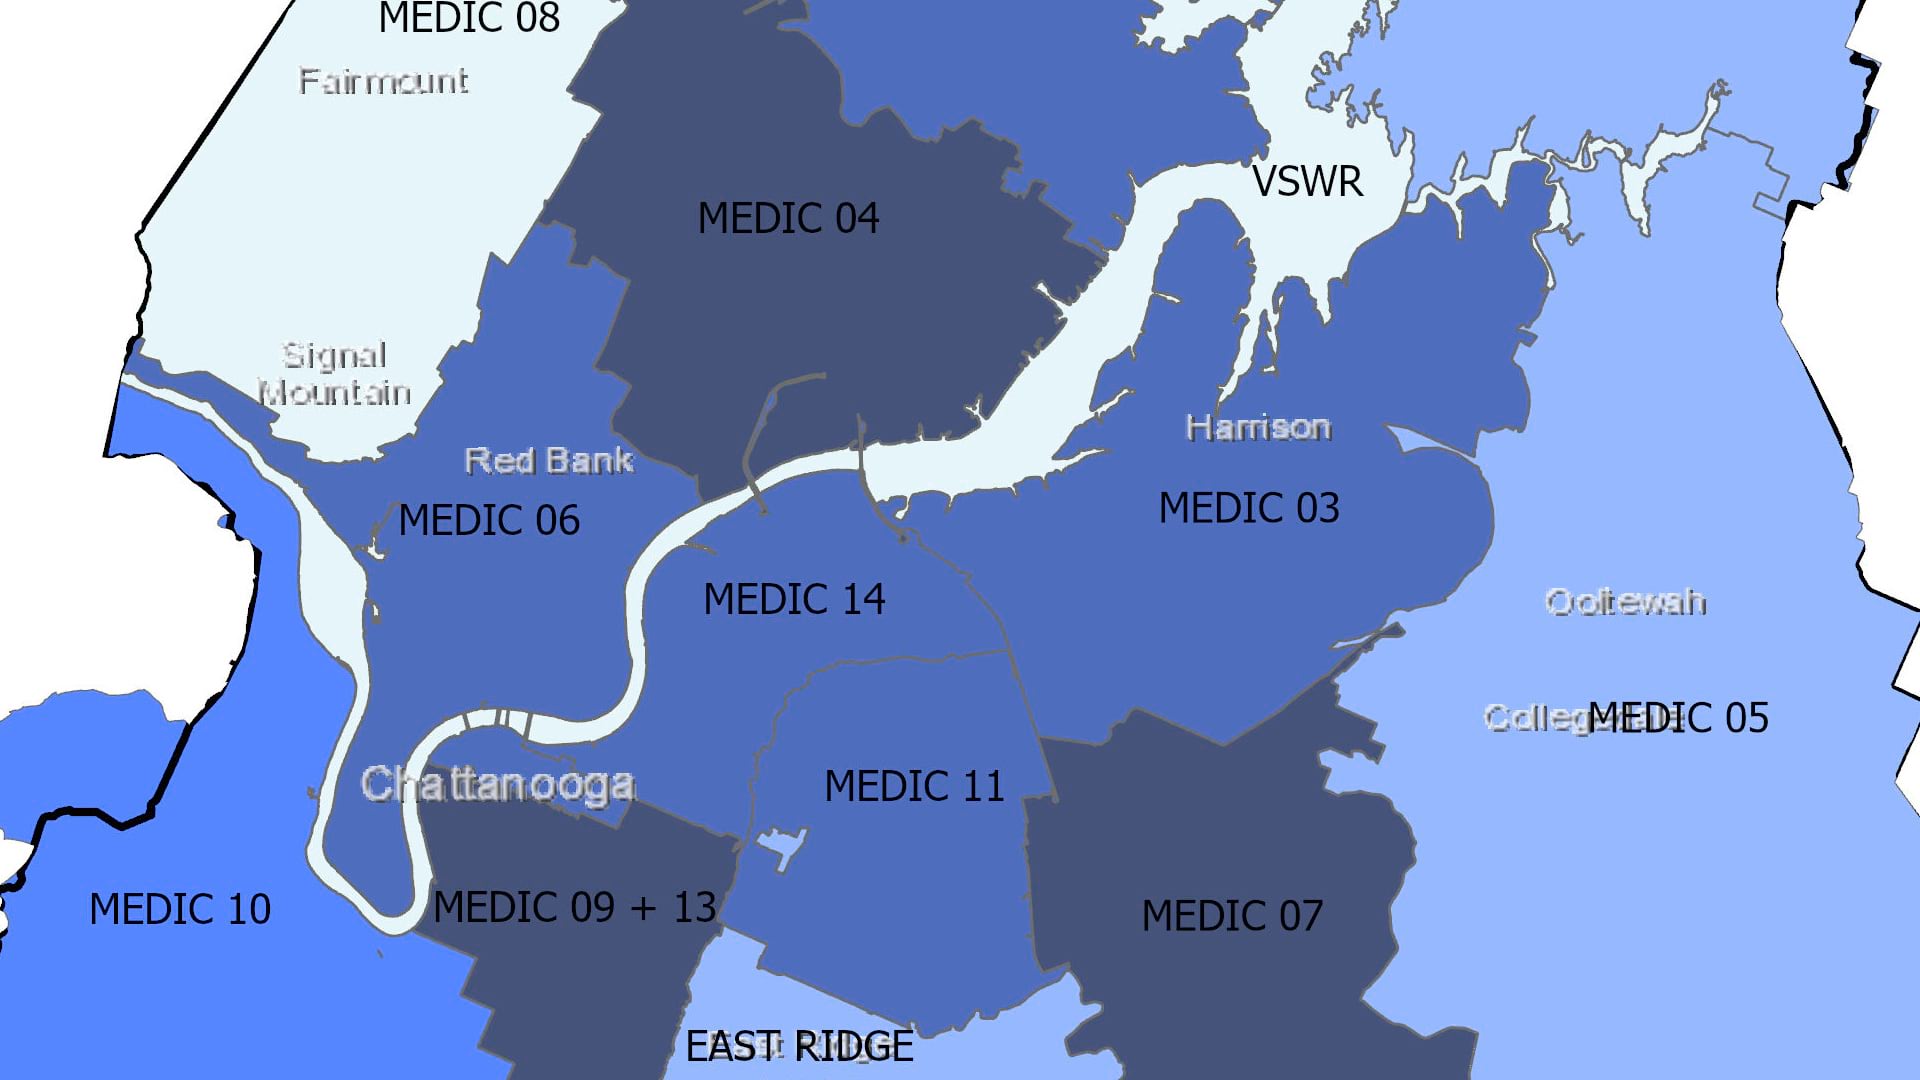
To apportion the naloxone kits, the research team, along with the two doctors leading the study, decided to distribute them based on the number of opioid overdose calls each EMS station got. This would identify which EMS stations were likely to respond to the highest number of opioid overdoses and provide an opioid overdose map for EMS station coverage areas.

For this analysis, the team first needed to calculate the opioid overdose percentage for each EMS coverage area. This would be used to determine the proportion of the total number of naloxone kits to allocate to each EMS station.
To evaluate the total number of overdoses per 911 response zone in Hamilton County, team members performed a spatial join of the point data representing opioid overdoses and a shapefile of the 911 response zones served by the EMS stations. Then, using the Enrich tool in ArcGIS Pro, they determined the total estimated population for each 911 response zone and used that to calculate the rate of overdose cases per EMS service area. This allowed the team to create maps that displayed the normalized rate of overdoses by 911 zone.
“Visualizing the data in this way enabled us to recognize patterns of opioid-related deaths within the county,” said Dr. Rebecca Martin, an emergency medical physician with Erlanger Health System who was involved in the project. “Identifying opioid overdose hot spots within Hamilton County allowed us to better understand the local epidemic and where to target interventions.”
Additionally, because Erlanger Health System operates multiple regional hospitals and emergency departments throughout the county, the data has “influenced administrative decisions within the health system regarding where to initiate programs aimed at combatting the opioid epidemic in order to benefit the most patients,” Martin added.
Gaining Deeper Understanding
In presenting their findings, team members from IGTLab also wanted stakeholders to be able to quickly understand other descriptive data contained in the EMS reports and ME records. So they used ArcGIS Insights to create and share graphs and other visuals that showed trends buried in the data, such as the age and racial characteristics of those who overdosed and the month, day, and time when these events occurred most frequently. It also gave researchers and medical planners the added benefit of interacting with the data and being able to perform their own analyses.

“The data has been used by administrators to reallocate EMS resources as well as emergency department resources to better serve the most vulnerable populations,” said Jessica Whittle, director of research in the Department of Emergency Medicine at UTC. “In addition, some of our medics have indicated that it gave them a sense of encouragement because they felt that the high rates of overdoses they were seeing were everywhere, when in fact they were working in an overdose hot spot. Now they view themselves more as specialists rather than people fighting an unwinnable war.”
Projects like this illustrate the power of maps and GIS as a collaborative tool for taking action and bringing about change, according to Mix.
“The UTC community is grateful for Esri’s support in helping respond [to] and solve these issues that our communities face,” he concluded.