
San Francisco International Airport (SFO) is the 17th-busiest airport in the United States and the 40th-busiest airport in the world by passenger count. Its facilities include 4 terminals; 6 parking garages; 11 AirTrain stations; 1 Bay Area Rapid Transit (BART) station; support buildings; and dozens of shuttle, bus, and transportation network company stops. Within the airport’s 17 million square feet of interior space, there are more than 15,000 defined locations for shopping, dining, maintenance, storage, and more.

Over the years, a variety of maps of the airport complex have been created for use by staff members, airline operators, retail tenants, and passengers. But these maps were produced using different sources, so they were often inconsistent with one another and out-of-date because of the continual development that takes place at SFO.
This became particularly apparent when SFO began its most recent capital improvement program. The undertaking, which will cost more than $7 billion, consists of hundreds of projects to upgrade buildings, taxiways, utilities, and security by 2026. It reflects the previously developed SFO Master Plan, which was based on data and maps kept in various files and formats.
To standardize map production, the GIS team within SFO’s Planning, Design, and Construction Division employed ArcGIS technology to develop three data models: one for subsurface utilities, one for exteriors, and one for interior spaces. Now, the hundreds of contractors and subcontractors working on capital improvement projects at SFO use data from the three models every day to streamline processes and update the airport so that its facilities meet the current and future needs of staff members, customers, and passengers.
More Ways to View and Work with Building Data
SFO has used ArcGIS technology for more than 14 years. During that time, the GIS team has deployed more than 50 apps and integrations to support operations, business and finance, planning, design and construction, emergency services, security, and retail trade.

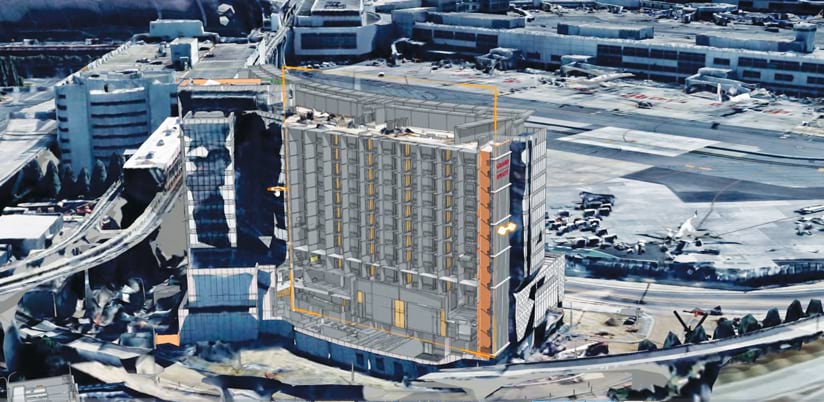
For design and construction projects, teams use building information modeling (BIM) data processed in Autodesk’s Revit software and computer-aided design (CAD) data processed in Autodesk’s AutoCAD and Civil 3D software. They capture data with GIS and use ArcGIS Enterprise extensively for map production and staging.
Prior to 2017, all interior data at SFO was maintained in CAD and BIM datasets on local networks. This limited who could use the data and what they could use it for.
“We have found that BIM and CAD programs can present some pretty big obstacles to widespread use due to licensing, training, and the necessity of robust computers to run the programs,” explained Hanson Guy Michael, GIS analyst for the Planning, Design, and Construction Division at SFO.
To ensure that all potential users of the data have access to it and can work with it, the GIS team decided to standardize the data on ArcGIS.
“ArcGIS provides us with broad access that serves all of our users’ needs,” Michael said. “Non-technical staff can examine [ArcGIS] StoryMaps or view data through their browsers via a web application or ArcGIS Online. Others may want the data in GeoJSON, KML [Keyhole Markup Language], or PDF formats—or to be able to consume data from an API, which we can easily generate from ArcGIS.”
To develop the SFO Interior Data Model, GIS analysts within the Planning, Design, and Construction Division converted thousands of CAD files to the ArcGIS format using Esri partner Safe Software’s FME data integration platform.

“Our interior data model represents rooms or other spaces as polygons,” said Agie Gilmore, another GIS analyst with SFO’s Planning, Design, and Construction Division. “Attributes include the space number, lease type, square footage, and other information provided by [SFO’s] Aviation Management group.”
Now, staff members use ArcGIS Pro and ArcGIS Field Maps, along with apps built with ArcGIS Web AppBuilder and ArcGIS Experience Builder, to inspect floor plans and update the business information associated with particular spaces, such as the tenant, the listing for the tenant’s doing business as (DBA) name, and the lease number. While working in the field, users can employ native and browser-based apps to open specific rooms and see their attributes, such as what type of lease a tenant has and how many months are left on the lease. And when new data is synchronized with the server, staff members can do analysis on it to find out things like how much retail space is being used in each terminal.
“ArcGIS Pro and ArcGIS Online have really allowed us to work in an enterprise environment,” said Gilmore. “SFO space planning analysts, who traditionally relied on CAD to manage floor plans and spaces, have transitioned parts of their standard workflows to ArcGIS Pro and ArcGIS Online in order to manage the thousands of leased spaces and hundreds of tenants, using GIS.”
So when staff members need to investigate a hazardous materials spill, view laser strike events (when lasers are pointed at aircraft) over time, or monitor airfield pavement conditions, the necessary location data is available because it is maintained in SFO’s enterprise GIS database. The three data models—subsurface, exterior, and interior—give staff a holistic picture of the airport. They can query the data in a web browser, since it is all maintained in ArcGIS. And some of the data can be subsequently converted for use by the public to help visitors navigate airport facilities using their mobile devices.
Future Improvements to the Airport Experience
In looking ahead, Michael, Gilmore, and the rest of the GIS team are working on integrating smart monitoring with SFO’s GIS to allow staff members to react dynamically to changes at the airport. This would help with big events, like responding to a natural hazard, and more minor occurrences, such as when an escalator breaks down.
-
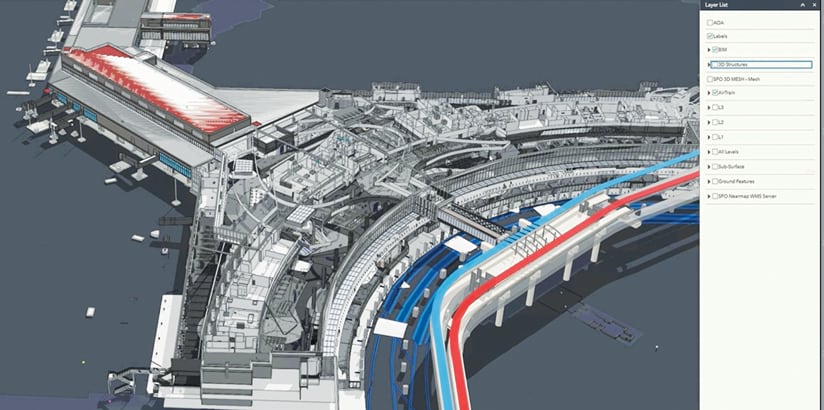
The GIS team within SFO’s Planning, Design, and Construction Division is currently building a 3D model of the airport campus.
The team is also employing 3D modeling and BIM data conversion to build a 3D model of the airport campus. This includes using ArcGIS Pro web scenes and textured mesh, employing 3D GIS objects as a BIM model in the building scene layer package, and modeling airfield signs in 3D with ArcGIS Aviation Airports.
“In the future, we would like to make use of the Internet of Things [IoT] to provide smart monitoring for our interior space,” said Michael. “This would [help] us improve energy efficiency, air quality, and noise reduction. It would also help us to quickly reroute our passengers intelligently and dynamically if necessary, depending on what is happening in a particular location of the airport.”
By improving the quality of SFO’s location intelligence, the GIS team is improving the airport experience for everyone who passes through, whether to work or to travel.