Despite a global pandemic, Esri brought the 2020 Esri User Conference (Esri UC) to the people. More than 88,000 registrants from around the world watched the first virtual Esri UC online, tuning in from home offices; meeting rooms; and, in at least one case, a camper in the woods.
Speaking live from Esri headquarters, Esri president Jack Dangermond opened the conference by thanking attendees for the remarkable work they do with GIS.
“This is a challenging time,” Dangermond said. “We have not just one issue—COVID-19—but [multiple issues],” such as the coronavirus disease 2019 (COVID-19) pandemic’s impact on people’s health, jobs, and the economy; racial disparities and inequities; climate change; and political polarization.
But the GIS community is working on these issues and more. “You are thinking about and implementing solutions,” Dangermond said.

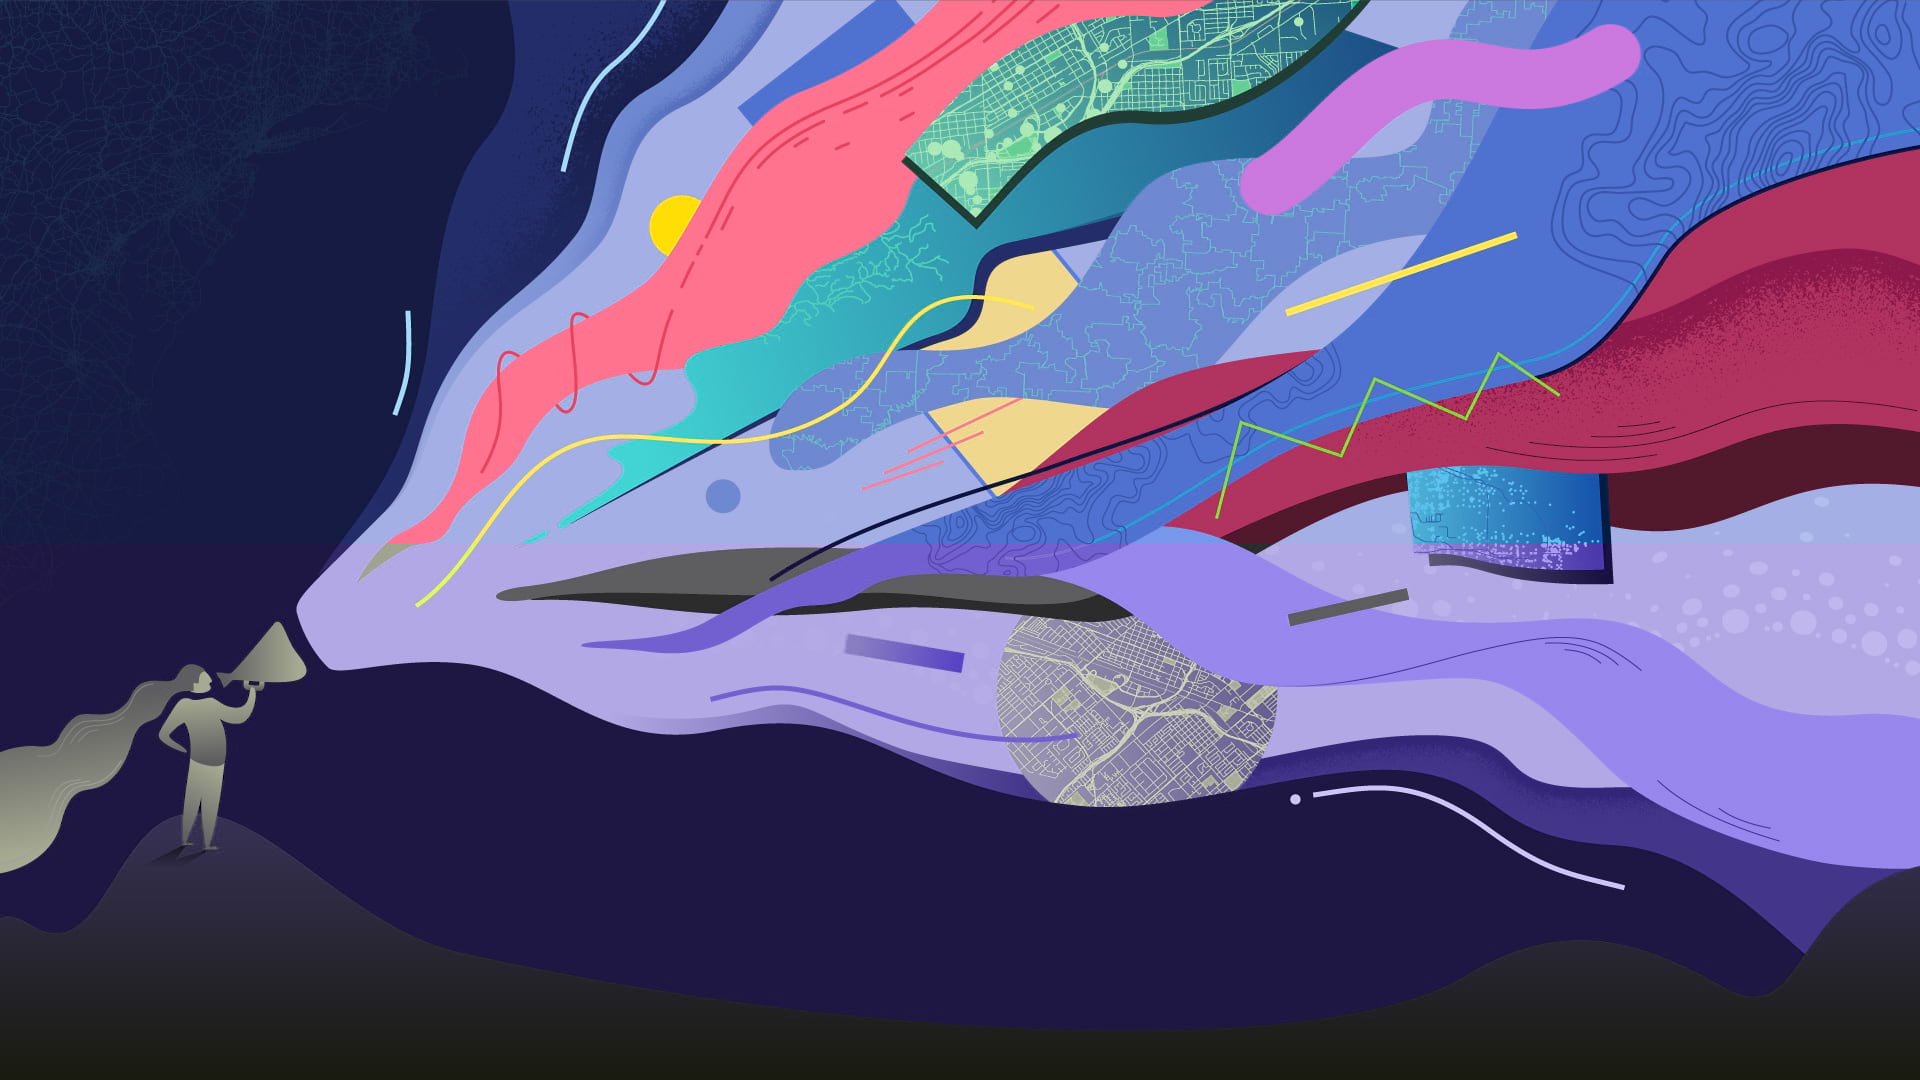
The theme of this year’s conference, GIS—Interconnecting Our World, is about using geographic science to better understand complex issues and solve problems. It also underscores a network of intertwined trends, including the increasing ease of use of GIS apps, the growing real-time aspect of the technology, the increasing number of geospatial hubs to promote community engagement, and the growth of interconnected GIS systems that create geospatial infrastructure.
Dangermond emphasized the need to use geographic science to tackle problems that also are interconnected: environmental degradation, social instability, climate change, natural disasters, and loss of nature. Overcoming these issues will require better understanding, communication, and collaboration, along with the best science, technology, problem solving, and design thinking, he said.
“Geography, our science; GIS, the technology; and you, the geospatial community, will be essential in creating…a geospatially literate society [to work on these issues],” Dangermond said.
A New Experience
To ensure that all members of this vibrant GIS community could get the most out of the conference, Esri created the 2020 Esri UC virtual platform, which registered attendees used to access the Plenary Session livestream, technical sessions, special interest group (SIG) meetings, the virtual Expo, the Map Gallery, and a networking app.
Although users expressed disappointment at not being able to be together in San Diego, California, this year, a number of people found the silver lining in getting to attend the event virtually.
Posting to Twitter from Awka, Nigeria, Chidimma Umeogu said, “Attending [the] #EsriUC…has always been a dream.” A PhD student and assistant lecturer at Nnamdi Azikiwe University and cofounder of African Women in GIS, Umeogu said in an interview that although she has always wanted to attend the Esri UC, it would be “a Herculean task.”

“Its being made virtual this year due to the pandemic granted us from low-income countries the opportunity to participate, network, and have a virtual experience of what the [Esri] UC is all about,” she said. “The experience made me feel more connected to the GIS industry and to all the key players.”
Brandi LeRoy, a high school geography, history, and GIS teacher from Bangor, Maine, said that while she prefers the in-person event, she was glad to get to join in this year.
“It’s always good to hear from Jack and see what’s new with ArcGIS technology,” she said. “It’s really helpful to see how people use GIS in other fields, since that’s part of what I want to show my students how far-reaching the technology is.”
Dangermond shared many examples of this far-reaching technology during the Plenary Session. He featured impressive maps from users and called attention to work being done with census data.
“[Some of the] maps show this issue that’s on all our minds today—social equity—[along with] racial and ethnic disparities for things like COVID-19…and access to healthy food,” he said.
Users have produced a profusion of maps and dashboards related to COVID-19, such as those showing numbers of cases and deaths, information about hospital admissions and patient status, and social distancing-based sidewalk analyses. Dangermond, along with Esri’s chief medical officer Este Geraghty and director of public safety and disaster response Ryan Lanclos, highlighted some from around the world.
“Your work on COVID-19 has been incredible,” Dangermond said. “It is saving lives, transitioning economies, and making the world safer.”
To help people and organizations continue to use geospatial technology to confront the pandemic and its effects, Esri released three new GIS capabilities: time series forecasting, space planners in ArcGIS Indoors, and community contact tracing. Learn more about them.
User-Focused Advances in ArcGIS
At Esri, teams continually add new capabilities to ArcGIS, often based on user feedback.
“Our main purpose…is to build tools that help you do your work better,” said Dangermond.

He highlighted advances in ArcGIS, including the integration of ArcGIS Notebooks, Esri’s implementation of Juypter Notebook, into ArcGIS Pro and ArcGIS Online. He also noted that, in addition to ArcGIS Drone2Map, the new cloud-based Site Scan for ArcGIS—for drone flight planning, image processing, and analysis—is now available.
The Plenary Session featured a number of demonstrations from Esri employees, starting with Map Viewer beta in ArcGIS Online.
“This is the next generation of online mapping that will help you explore your data quickly and create stunning maps that can be shared across the ArcGIS platform,” said senior solution engineer Madeline Schueren.
Ivonne Seler, 3D program manager and product owner of scene layers, demonstrated 3D voxel layers in ArcGIS Pro. Voxels offer a stunning new way to understand complex, multi-dimensional data.
“You can slice through the voxel volume to discover information hidden inside,” she said.

Diving into ArcGIS Utility Network, technical consultant Deilson da Silva demonstrated how telecommunications companies can use new nonspatial object capabilities to model complex networks without duplicating geometries. Performing an upstream trace from a new customer location, da Silva was able to see all the equipment needed to add service to that location.
Finally, solution engineer Kenyon Huber-Wilker showed the audience how to use LocateXT, an extension for ArcGIS Pro and ArcGIS Enterprise that extracts locations, text, and dates from unstructured documents. Taking 546 Mayan archaeological documents, which included Microsoft Word files, emails, and PDFs, Huber-Wilker loaded them in ArcGIS Pro, extracted the locations and attributes of Mayan sites, and added them to a map. LocateXT can also now extract dates in foreign languages and convert them to standard date-time formats.
Analytics Takes Center Stage
The Plenary Session featured other advanced tools from across the platform as well, including new raster analysis tools that let users detect, analyze, and predict change over space and time.

Looking at eastern Massachusetts, imagery product engineer Julia Lenhardt used the new continuous change detection tool to analyze a stack of 286 Landsat images in a single image cube to see how land cover there has changed over the past 18 years. Imagery product manager Vinay Viswambharan then showed viewers how to use two new multidimensional raster tools—one that analyzes trends and one that does predictive analysis—by looking at sea surface temperature data over the last 35 years. Using an image cube that contains more than 2,000 slices of data, Viswambharan extracted trend information over time from every pixel within the cube. On a global map, the resultant red spots showed where temperature trends are increasing. He also used the Prediction tool to analyze sea surface temperature trends out to 2030.
“This…enables you to perform predictive analysis on large-scale raster data,” he said, adding that processing is done on the fly.
Suzanne Foss, product manager for ArcGIS Velocity, demonstrated how the California Department of Toxic Substances Control (DTSC) is exploring using Velocity to closely monitor how hazardous waste travels through communities. Tracking devices on trucks paired with Esri’s cloud-based Internet of Things (IoT) technology would allow DTSC to do geofencing, incident detection, and pattern analysis in real time, near real time, or over time—without writing code.
Shannon Kalisky, lead product manager for analytics and data science, then showed how Esri is making it easier for users to get started with deep learning models and frameworks. With 15 deep learning models now included in ArcGIS API for Python, “all you have to do is pick a model that fits your problem and start training,” she said.

She took viewers to a map of Jamaica Bay, New York, and used deep learning to detect boats in the water. Kalisky brought in ground truth data to teach the model what to look for, used the built-in learning rate finder to identify an optimal learning rate, and let the model train itself. It did exactly what she wanted it to do: identify all the boats in the bay and leave out any on land.
“Now, when we get updated imagery in the area, all we need to do is rerun our model, and we’ll get an updated feature class of boats in the bay,” she said.
Employing the same deep learning process and model with a different workflow, Kalisky then detected the hundreds of ships that sank there during Superstorm Sandy in 2012. She even used the features generated by the model to update nautical charts.
A Global GIS
While GIS goes a long way in trying to solve the world’s big problems, being successful will require more sharing of information.
“Your collective work is starting to emerge as a kind of global GIS,” Dangermond said.

But now is the time to share information more widely. “We need to leverage this information for greater things,” he added.
That process began several years ago when Esri started collaborating with organizations including Microsoft, the United Nations (UN), the National Geographic Society, and the E.O. Wilson Biodiversity Foundation.
“This consortium envisions creating and [sharing] a new class of digital experiences for different communities,” Dangermond said.
The group is dedicated to producing digital experiences that are easier to work with than traditional GIS technology has been, according to Dangermond. “It’s not as if we are not making progress in that domain,” he said. “But we need to make a dramatic jump if we are going to transform the world with the kind of holism that so many of you appreciate.”
One example of an engaging digital experience that Esri built is ArcGIS Living Atlas—Indicators of the Planet. The app, created using cards in ArcGIS Experience Builder, displays recent data on the planet’s health and safety. People can click on points on the interactive maps to see, for instance, the latest air quality and deforestation information from around the world.

Esri technology evangelist Bern Szukalski demonstrated the app for the Plenary Session audience.
“It’s a new addition to [ArcGIS Living Atlas of the World], and it’s a destination where anyone can go to look at these key global indicators and see [their] current status and conditions,” Szukalski said.
Each card focuses on a particular topic and is powered by ArcGIS Living Atlas content, which means it is curated, authoritative, and updated continually. The template can be customized for any organization’s topics, too.
“The individual cards package a lot of information together in a shareable and embeddable way,” Szukalski said. “If you [work for] a city or state, a federal agency, a conservation organization, or a university research center, you are going to use applications like this…to create sites to inform others, drive policy, and make better decisions.”
Stories About a Changing Planet
Educators and young people are great at sharing information—and, according to Vicki Phillips, executive vice president and chief education officer of the National Geographic Society, they are also critical to finding solutions to the planet’s most pressing problems.
Speaking at the Plenary Session about the National Geographic Society’s new education strategy, Phillips said the organization plans to use GIS to tell stories about how the planet is changing.
“Our goal is to cultivate empathy for the earth among 100 million young people…and lift the voices of 5 million young leaders,” she said.
The National Geographic Society’s education program will equip 2.5 million educators with what Phillips called “game-changing content and tools”—science, social studies, and geography content delivered anywhere, anytime, and on any device. In partnership with Esri, the National Geographic Society will educate millions about geography and how to use it to solve problems.
MapMaker Interactive, which the National Geographic Society has collaborated on with Esri, is a free app that does just that. Additionally, the team has developed several other no-cost resources for classroom and home-learning environments, including 20 activities for addressing and understanding climate change, ArcGIS Online SkillBuilder activities, ArcGIS StoryMaps stories, and access to the beta site Teach with GIS. These will be hosted on both the National Geographic Society’s Education Resource Library and Esri websites.
“[The tools] are going to allow educators to help young people have the knowledge and skills they need to act with urgency and be the architects of change,” Phillips said.
A Network for Sustainable Development
Another group that’s well equipped to help build solutions to address the world’s problems is GIS users.
In talking with economist Jeffrey Sachs, president of the UN Sustainable Development Solutions Network (SDSN) and director of the Center for Sustainable Development at Columbia University, Dangermond highlighted how the business community—and GIS professionals and geographers, specifically—have the expertise and tools needed to make the UN Sustainable Development Goals (SDGs) come alive.
“We need a big change of direction on the planet,” Sachs said. “We are enmeshed in an unprecedentedly complex challenge of [having] eight billion interconnected people…every one of [whom] wants and deserves and needs safe water and a nutritious diet each day and a healthful environment—and they’re not getting that.”
These and other global issues are what the SDGs aim to tackle. To support that work, Sachs developed the SDSN, which brings together thought leaders, scientists, universities, and now the business community to create practical solutions.

The newly launched SDGs Today website, built as a partnership between the SDSN and Esri, supports this by aggregating relevant real-time data from around the world. Cards, like the ones Szukalski demonstrated, allow site visitors to drill down into complex topics, such as food insecurity, and see what could be contributing to them in certain areas.
Sachs is hoping that the GIS community will submit data to the SDGs Today website and expand the number of topics it covers.
“I want people to look at these goals and the targets that go along with them and ask…how can I contribute to the solution?” said Sachs.
Dangermond agreed to keep contributing and urged attendees to do the same.
“At this great time of change, you…have so much to offer,” he told viewers. “If we’re going to create a sustainable future in the world…we’ve got to double down on this in virtually everything we do.”
Watch all the Plenary Session videos from the 2020 Esri UC.