The Pacific Ocean covers more than 30 percent of the earth’s surface, is the largest water mass on the planet, has a basin bigger than the landmass of all the continents combined, has twice the amount of water as the Atlantic Ocean, and is the planet’s deepest water body. So what investments are made in the Pacific Ocean, what benefits does it provide, and what do we know about its natural capital?
Over the course of 2019, the United Nations (UN) Economic and Social Commission for Asia and the Pacific (ESCAP) partnered with Esri to develop a Pacific Ocean Accounting Portal that uses GIS to direct attention to these and other questions about the Pacific Ocean.

The idea to create a portal using Esri’s ArcGIS Hub technology was conceived at the inaugural United Nations World Geospatial Information Congress, held in Deqing, Zhejiang Province, China, in November 2018. The congress provided a convening, participatory, and inclusive environment to intensify collaboration at the regional and global levels and encourage the development of value-added apps and services to address local, national, regional, and global challenges. Esri president Jack Dangermond was a keynote speaker at the congress, and I had the pleasure of meeting with him to discuss the idea of combining the power of GIS and statistics to address local, national, and regional challenges in Asia and the Pacific, specifically focused on oceans.
Fast-forward 12 months, and at the 2019 Esri Ocean and Atmospheric GIS Forum, held in Redlands, California, in November, a prototype Pacific Ocean Accounting Portal was born.
“We measure what matters” is a well-known phrase, and measurements need to be of practical use, particularly to decision-makers. The reality is that many decision-makers are time poor and need tools to help them quickly understand what the issue is and what’s going on. Decision-makers also often focus on public concerns, such as jobs, the economy, security, people’s well-being, and disasters.

By combining the power of GIS with statistics, the Pacific Ocean Accounting Portal aims to bring attention to the Pacific Ocean in ways that decision-makers can quickly see and understand. It also seeks to support the many countries that rely on it—especially the small island developing states that depend so heavily on the Pacific Ocean for their livelihoods.
The UN is committed to the power of information, yet we know very little about the ocean. The UN 2030 Agenda for Sustainable Development is a shared blueprint for peace and prosperity for people and the planet, now and into the future. At its heart are 17 Sustainable Development Goals (SDGs). The SDGs recognize that ending poverty and other deprivations go hand in hand with developing strategies to improve health and education, reduce inequality, and spur economic growth—all while taking action to tackle climate change and preserve oceans and forests.
One goal, Life Below Water, also known as SDG 14, is devoted to our oceans. World leaders have agreed to monitor and measure progress in SDG 14 via 10 indicators, including marine pollution, fisheries subsidies, marine and coastal ecosystem management and protection, and ocean acidification. In Asia and the Pacific, however, we only have sufficient data to measure progress on 1 of the 10 globally agreed-on indicators for SDG 14—coastal and marine area conservation (indicator 14.5.1)—and 1 agreed-on proxy for marine pollution (indicator 14.1.1).
Data about the Pacific Ocean does exist, and many actors are working to bring visibility to this data in general and to the data that’s relevant for SDG 14. But ESCAP’s research shows that data about the Pacific Ocean is fragmented, not easy to access, not always publicly accessible, and not comparable. In fact, the data is often not integrated with other data systems, which means it is underpowered.
The Pacific Ocean Accounting Portal was developed to demonstrate what is possible if data is brought together in a user-centric, publicly accessible portal—and in a standardized and structured way.

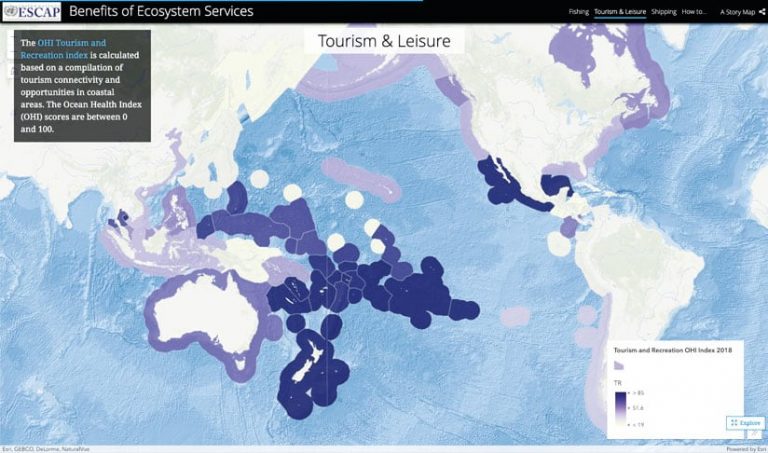
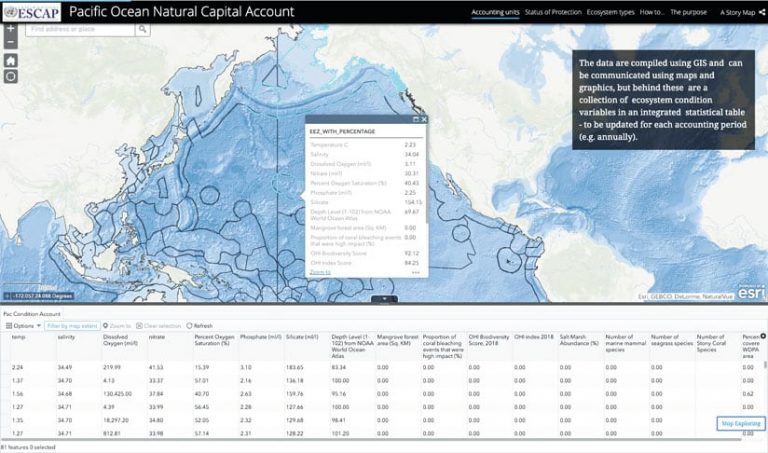
The prototype portal employs several innovations to make it easy for people to access data and information about one of the world’s largest natural resources. The portal spatially integrates public data about the protection, rehabilitation, restoration, and governance of the Pacific Ocean; what condition this huge body of water is in; and the benefits that people and whole communities can reap from the Pacific Ocean, including fishing and tourism.
Using ArcGIS Hub, users can access the data in real time via dashboards, story maps, tables, and infographics. The portal adds value to data by leveraging a well-known organizing framework, the System of National Accounts, from which gross domestic product (GDP) and other economic measures are derived. Decision-makers and portal users can, therefore, find answers to three fairly basic questions: How is the Pacific Ocean being managed, how healthy is it, and what is it being used for?
Increasingly, people are asking these questions. Michael B. Jones, president of TMA BlueTech (formerly The Maritime Alliance), gave a compelling speech at the Esri Ocean and Atmospheric GIS Forum immediately following ESCAP’s demonstration of the portal. He spoke on the economic value of the ocean. Jones cited estimates from the Organisation for Economic Co-operation and Development (OECD) that measured the direct contribution of the ocean economy to the world economy in 2010 to have been US$1.5 trillion (in gross value added). This translates to 2.5 percent of world gross value added, less than 3 percent of world GDP, and 5–6 percent of the global real economy. These powerful figures are just one example of the types of information the portal’s organizing framework is designed to provide.
The portal demonstrates that challenges do exist when it comes to really getting power from data. Integrating various types of data, including geospatial and statistical data, is one of these challenges. Bringing geospatial and statistical experts together is another. However, the portal has shown that these challenges can be overcome.

In fact, the prototype portal itself provides an opportunity for innovation. It’s not just a portal of useful, related datasets; the datasets are actually integrated so users can find data and information about a particular spatial unit, such as an island, a marine zone, or the ocean as a whole. Integrating data spatially requires innovation, and ESCAP welcomes comment on the methodology it adopted. If there is an efficient and appropriate approach for integrating data across data types with spatial resolution that is meaningful for decision-makers, we welcome ideas!
Next steps for the portal are to showcase it to a wide audience—especially decision-makers who rely heavily on meaningful and official data and statistics—build excitement, and mobilize resources for future developments and use. ESCAP’s demonstration of the portal at the Esri Ocean and Atmospheric GIS Forum was the first of several planned presentations that are intended to inform next steps for the data portal and its future.
Both ESCAP and Esri invite you to visit the prototype Pacific Ocean Accounting Portal and learn more about the Pacific Ocean through the power of ArcGIS Hub technology. Please send any feedback or comments to stat.unescap@un.org.


