ArcGIS Arcade has grown and matured throughout the ArcGIS system over the past few years. This expression language, created by Esri, allows users to write equations that take data, evaluate it, and return results that the map then treats like any other attribute. In its simplest form, users can think of Arcade as an in-map calculator that resembles the Microsoft Excel experience of creating a formula.
While ArcGIS Online supports multiple scripting languages, Arcade is unique. It is geospatial, lightweight, secure, dynamic, and portable across ArcGIS. This means that Arcade can quickly become a key part of efficient workflows in ArcGIS Online.

A Unique, Dynamic Scripting Language
With Arcade, users can create expressions that include spatial operations—functions that generate spatial data from specified input data—like buffers. Arcade understands geometry, features, layers, and maps. Expressions execute quickly, and Arcade works equally well on mobile devices and desktop computers.
Unlike other scripting languages, Arcade doesn’t require big libraries for the expressions to work. It is also a self-contained scripting language, meaning users can only execute it within specific contexts of the ArcGIS system. This guards it from being injected with malicious code.
One of the key benefits of Arcade is that it is portable in two ways. First, users can write an expression once and use it across the ArcGIS system, including in ArcGIS Pro, the ArcGIS Runtime SDKs, ArcGIS API for JavaScript, ArcGIS Online, and many apps. Existing expressions are accessible in the Arcade editor and autopopulate into the expression window when selected. Second, expressions are honored in downstream applications because expressions are stored within the map. For example, an expression written to customize a pop-up in a web map will also appear when the map is added to, say, ArcGIS StoryMaps.
Arcade expressions are dynamic, which is ideal for a world filled with live feeds and web layers that continually get updated. The scripting language adapts to changing data, so users don’t need to perform additional configurations and calculations. Whenever a viewer loads a map, Arcade calculates the values from the expression on the fly, delivering results that reflect the latest features and attributes.

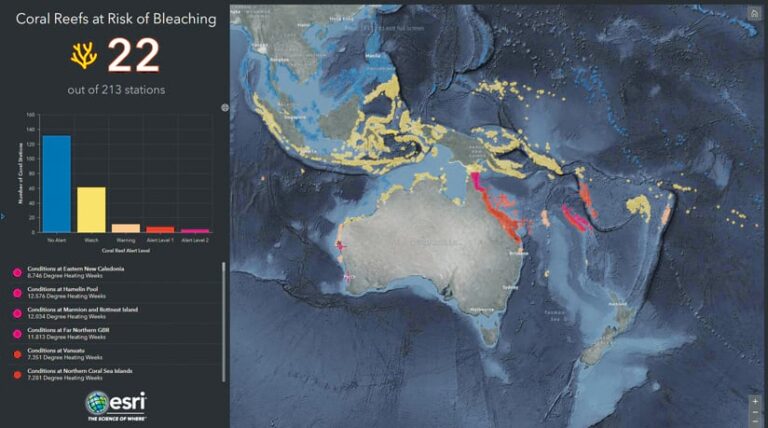
The Coral Reefs at Risk of Bleaching dashboard in ArcGIS Living Atlas of the World is a great example of how dynamic Arcade expressions work. The dashboard includes a live feed layer with daily updated data from the National Oceanic and Atmospheric Administration (NOAA) that shows coral reefs around the world experiencing heat stress. Arcade expressions define the layer’s visualization and pop-ups so the color of the points on the map and the text within the pop-ups correspond to concern levels (e.g., no alert, watch, warning, alert level 1, and alert level 2) that are defined by the latest conditions.
Several Ways to Simplify Complicated Workflows
Users who are familiar with traditional, more manual workflows may be surprised by how powerful and smooth Arcade is. It releases users from some of the constrictions that make it difficult to work with numerous data sources and increases the options available for presenting data on maps, in pop-ups, and more.
Take a look at several ways Arcade can simplify complicated workflows in ArcGIS Online.
Freedom from Constraints
To understand the freedom Arcade provides, consider the following scenario. A map author wants to use a layer from a trusted source, but she needs one field formatted differently, plus one additional field. Historically, she would have had to contact the layer’s owner and ask him to update the layer—and hope that he agreed to do so. Arcade overcomes this challenge by giving users the ability to customize and calculate new data values themselves without editing the database. Because nothing is being written to the database, users don’t need owner capabilities.
More Options for Visualization
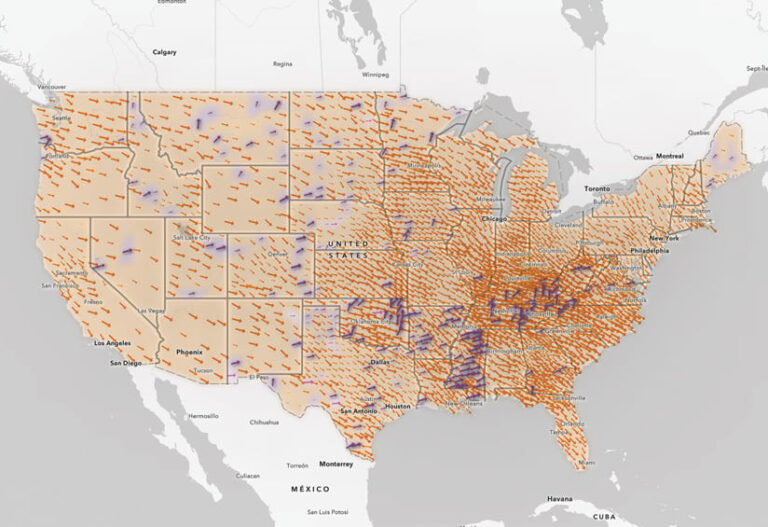
With Arcade, users can transform data to make distinctive and informative symbols and layers. Based on a calculated field, users can resize, rotate, and set transparency for the symbols in their maps to better fit a map’s scale or represent a particular field. Symbols can also be rotated to indicate direction or status.

To create and customize labels with Arcade, users can define label classes, combine fields, and alter text. Label classes employ Arcade expressions to designate values, such as lowest and highest home values. If the data that needs to be showcased in a label is spread across multiple fields, users can employ Arcade to combine them. For instance, if a label reads “red star,” the color can come from one field and the shape from another. Additionally, Arcade can help users alter the text in a label—to add commas and units of measurement, for example, or replace title case with sentence case.
The Power of Data-Driven Pop-Ups
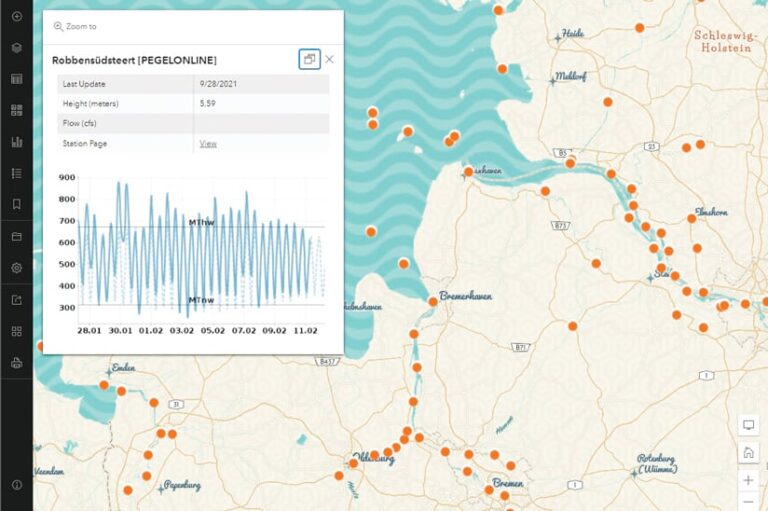
Pop-ups are little windows into additional information. With Arcade, users can deftly turn a default table of elements into an informative, data-driven pop-up. They can even incorporate data from other layers, including layers they don’t own and layers that aren’t in the map.
Arcade performs calculations to bring information from overlapping layers into one pop-up. These more cohesive pop-ups can display information about fields that have intersecting locations, rather than making users toggle through multiple pop-ups in a single location. This could be helpful, for example, if a user wants to display the names of elementary, middle, and high schools along with building footprint information, such as the year each building was constructed.
Dynamic, On-the-Fly Calculations
Instead of making users add fields to a database, Arcade performs dynamic data calculations on the fly, saving users time and allowing them to explore data in new ways. Arcade can convert field types, calculate new fields, get statistics for a layer, perform spatial calculations, and create categories from numbers.
With just a few lines of code written in a map, Arcade can take values that are stored in a text field and quickly transform them into numbers, making it possible to visualize this data even if it’s formatted incorrectly in the table. Expressions can also be used to quickly and easily convert, say, height from meters to feet.

Users can also write expressions to calculate percentages, ratios, absolute values, and more. This is useful, for instance, when someone has data on the number of households in a city that don’t own a vehicle but wants to show this as a percentage of total households instead, which can be a more effective way of looking at the data.
Arcade also makes it easier to display statistics for a layer, such as the sum, count, average, and standard deviation. For example, users can calculate the count of each type of tree within a layer to determine the most common tree species in a neighborhood. Arcade performs geometry-based functions as well, such as calculating population density, buffers, intersects, and contains. The scripting language enables users to perform spatial joins and do geoprocessing with layers outside their maps, dynamically, in real time.
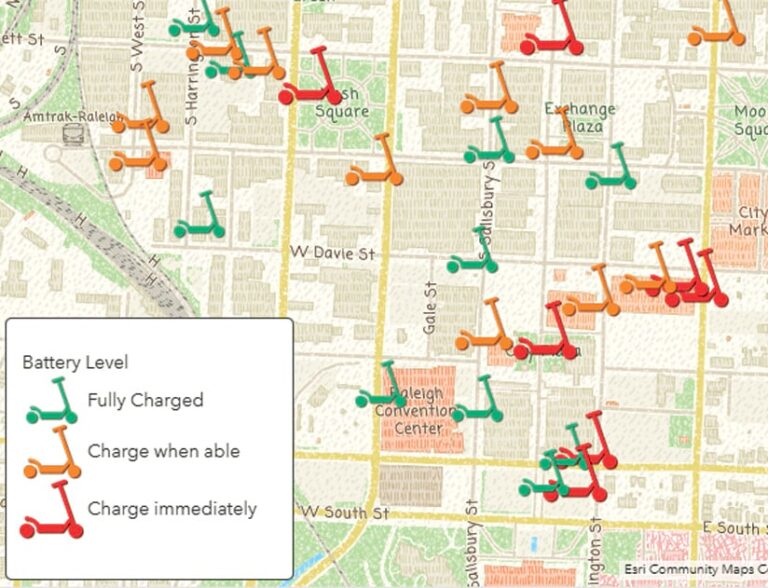
In addition, users can employ Arcade expressions to turn numeric values into categories. Imagine, for instance, that an employee at a mobility company is tasked with charging electric scooters. To quickly visualize which scooters need to be charged first, the employee could convert the battery level field from a numeric value into categories such as Charge Immediately for scooters with less than 50 percent battery, Charge When Able for scooters with batteries at 50–90 percent, and Fully Charged for scooters with batteries that are more than 90 percent charged.
With its ability to transform data nimbly and dynamically into impactful visualizations, Arcade can become a key part of anyone’s efficient workflows in ArcGIS Online. To learn more about using Arcade in ArcGIS Online, visit ArcGIS Blog.

