GIS Helps Inform Key DC Transportation, Tourism, and Enforcement Stakeholders
Transportation planners in urban tourism destinations around the globe are confronted with the task of creating routes and associated policies that will minimize congestion and optimize traffic flows. Washington, DC, is home to the United States government, bringing in commuters from near and far while simultaneously acting as a global tourist destination to millions of visitors wishing to experience the historical and cultural landscape. As such, DC can act as an exemplar for transportation planning processes from which other urban destinations can benefit.
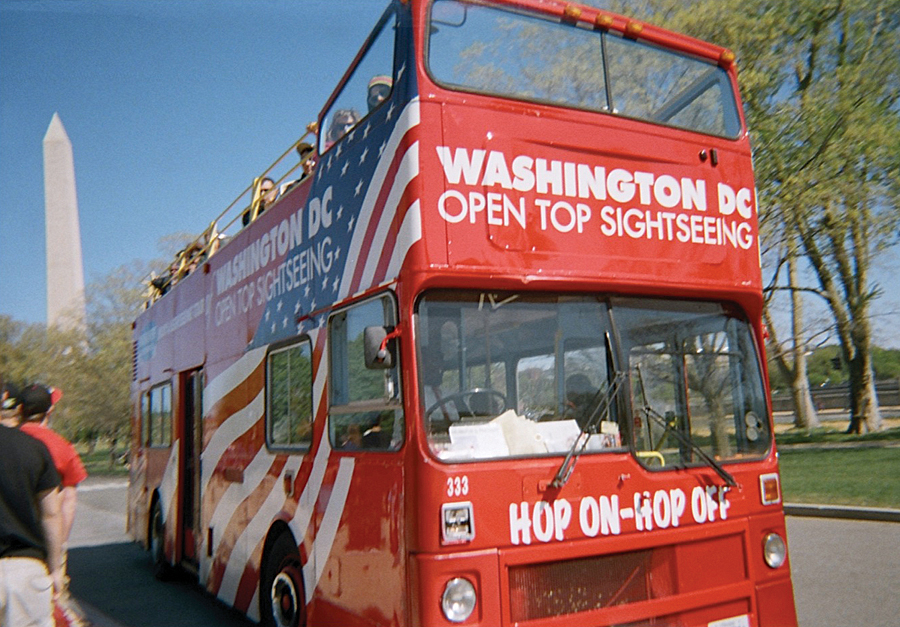
Much of DC tourism is concentrated within and directly surrounding the highly recognized and iconic National Mall and Memorial Parks (National Mall). The National Mall is 684 acres of dedicated parklands and home to many memorials that honor significant individuals and events in US history. In its 2010 National Mall Plan, the National Park Service (NPS), the government agency that manages the National Mall, reported more than 21 million visits annually to the parklands, with as many as one-third of visitors arriving via tour buses. Visitor statistics released by Destination DC, a private, nonprofit marketing organization supporting DC travel, report that tourism adds more than $6 billion to the local economy and supports more than 76,000 jobs annually. These same statistics forecast that visitation levels will continue to rise.

With concerns regarding carrying capacity and resource degradation in mind, DC policy makers and tourism planners are looking for ways to improve visitor experiences while preserving a national landscape. While recognizing positive economic impacts of group travel via tour bus, these benefits do come at a high price paid in traffic congestion, air pollution, pedestrian conflicts, traffic accidents, infrastructure deterioration, view obstruction, neighborhood disruptions, and parking shortages. These are some of the issues NPS and other stakeholders are trying to address as they plan for the future of the National Mall.
Researchers at George Mason University (GMU) in Fairfax, Virginia, were contracted by NPS to document existing conditions relating to current tour bus operations and make specific recommendations informing policy makers on improvements to the efficiency of tour bus transport. As such, GMU researchers are using GIS technology to collaborate with key DC transportation, tourism, and enforcement stakeholders in conducting a multiphase study that will ultimately be integrated into a comprehensive plan of action for short- and long-term improvements in tour bus operational efficiency within the National Mall. The current application is specific to assessing ingress patterns through spatial analysis.

Tour bus operations and flows are spatial problems that cannot be solved without integrating and understanding route choice patterns. Esri has entered into a cooperative agreement with GMU and other Virginia universities to license its ArcGIS suite of products, which allowed GMU researchers to visualize, analyze, and convey ingress patterns to all stakeholders. Of particular benefit was the ability to quickly understand and map the relationships present in the data using statistical and graphical functions available in GIS.
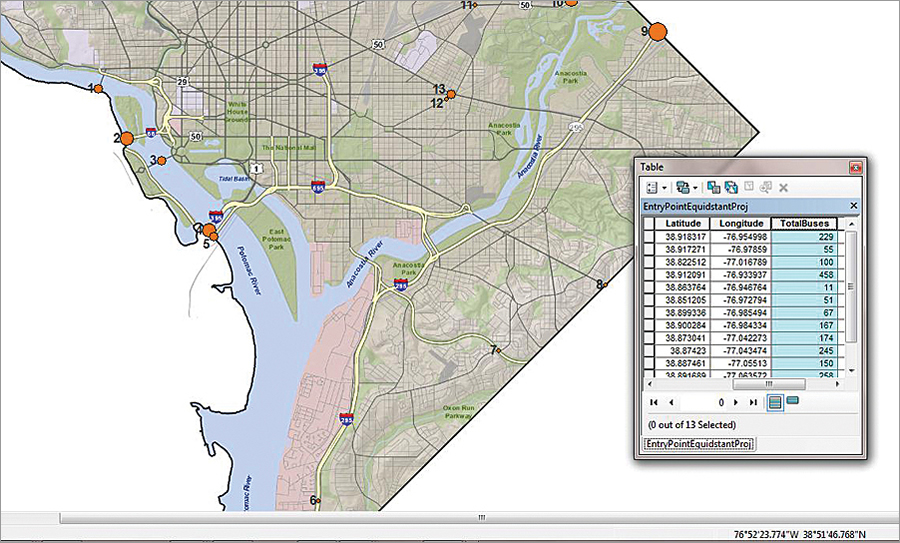
The number of private and public buses and motor coaches entering DC was counted at 13 select locations. Counts were made and initially tabulated by the Metropolitan Washington Council of Governments, a nonprofit regional planning agency for DC, Maryland, and northern Virginia. These entry point locations were chosen to represent the main routes of tour buses transporting visitors to DC. GMU researchers then used ArcGIS as an exploratory data analysis tool to uncover spatial and statistical patterns inherent in the data that are not readily apparent when simply reviewing spreadsheet data.
Using ArcGIS, GMU researchers were able to spatially document and translate the variations in number and composition of buses entering at each location, thus highlighting the entry points that are most influential in bringing tourism to DC. While trying to understand relationships from the spreadsheet of raw values was proving difficult, simple spatial analysis techniques clarified the varying attributes at each location and aided in determining where resources should be allocated to reduce traffic congestion.
Using map services published through DC GIS, which provides government agencies and the public with access to DC geospatial data, an updated standard basemap was consumed. The analysis map was then developed by overlaying entry point locations. A review of the distribution of geographic locations in conjunction with temporal data regarding when counts were taken allowed GMU researchers to identify areas where double counting may have occurred, thus influencing overall counts and suggesting the need for additional data collection to cross-check select sites. This important methodological information was found to be much easier to glean once the data was mapped using ArcGIS.

Next, researchers used normalized data and graduated symbols to understand and represent differences in volumes. A graduated symbology with natural breaks was found to be effective for determining and visualizing tour bus volumes. Mapping the average number of buses passing each location, researchers were easily able to distinguish and visualize the routes that were most heavily utilized by tour buses; this information was used as a proxy for carrying capacity.
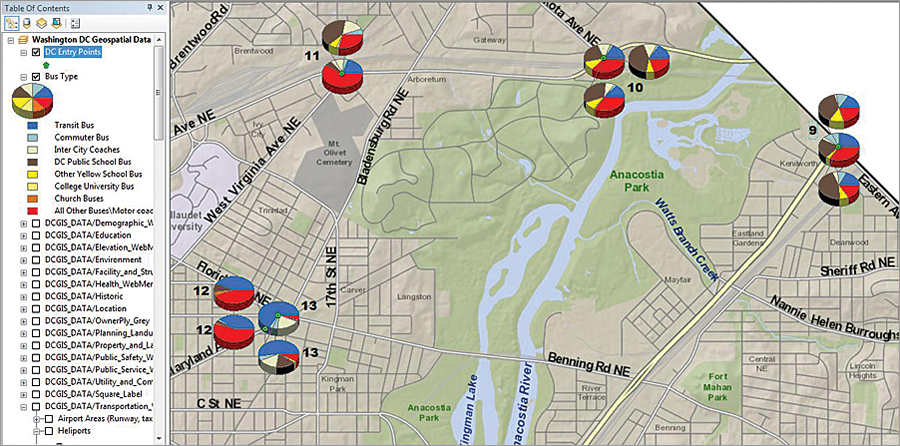
ArcGIS offers a variety of symbology choices to help display statistical data. Utilizing the ability to generate pie charts based on multiple attributes of discrete features, GMU researchers were easily able to understand and convey the variability between different locations. While documenting the percentage of buses utilizing different routes was instructive, what proved to be most revealing was the composition of buses that were using select entry points. For instance, it was found that many locations that initially had the highest volumes of buses were actually being influenced by a propensity of school buses transporting students, not tourists, into DC from the north. Such a trend was easily discernible by charting the composition of buses observed at each site.
The framework discussed in this article was used by researchers to help understand the route choice decisions, carrying capacity, and composition of buses entering DC. The findings, combined with spatial data regarding tourist loading zones, parking data, and tour itineraries, will inform planners’ and policy makers’ decisions regarding tour bus routing in and around DC. Other major urban tourism destinations can use GIS technology and apply similar techniques to improve operational efficiency for drivers and thus increase the overall satisfaction of the visiting public.
For more information, contact Rodney Vese Jr., MS, research assistant, George Mason University, School of Recreation, Health, and Tourism, or Margaret J. Daniels, PhD, associate professor, George Mason University, School of Recreation, Health, and Tourism.

