According to the Pew Research Center, roughly 42.5 million Americans—about 13 percent of the country’s noninstitutionalized population—have disabilities. These individuals, who face challenges related to hearing, vision, cognitive function, walking, self-care, independent living, and more, often struggle to be seen and heard relative to the rest of the population.
Of all major US cities, Philadelphia has the highest percentage of individuals with disabilities—almost 17 percent. According to US Census Bureau data from 2020, Philadelphia is also one of the poorest major cities in the United States, which has made addressing disability-related issues particularly challenging.
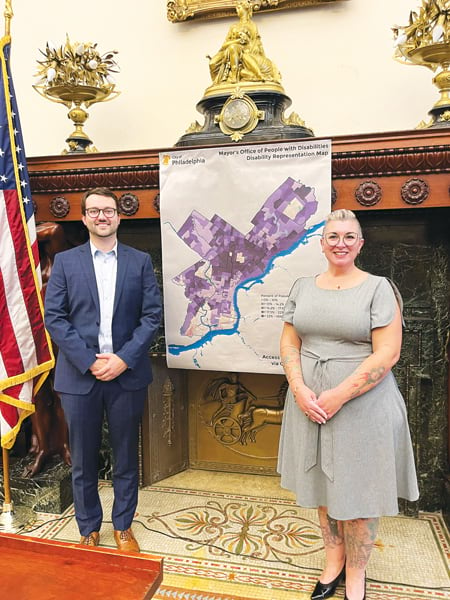
This is why two Philadelphia city employees set out to create a map, published in 2022 and incorporating major accessibility upgrades in late 2023, that shows characteristics of the nearly quarter-million Philadelphians with disabilities.

In the process of creating this map, and with assistance from the Esri accessibility team, these GIS visionaries have set the stage for improved representation of people with disabilities in Philadelphia and beyond. They also may have set new standards in map accessibility.
Using GIS to Represent the Underrepresented
In 2019, Daniel Warner, a GIS analyst for the City of Philadelphia, used US Census Bureau estimates to create a map showing the population density of Philadelphians with disabilities on a neighborhood level. His idea was to use this information to get more Philadelphians with disabilities to participate in the 2020 Census.
Of course, when COVID-19 hit, other issues took center stage. By 2021, the map was all but forgotten, and Warner was thinking about deleting it.
But one key person remembered Warner’s map: Amy Nieves, a longtime advocate for the city’s disabled population who was named executive director of Philadelphia’s Mayor’s Office for People with Disabilities in 2021. Nieves reached out to Warner, beginning a collaboration that has helped improve programs, services, and activities for people with disabilities in Philadelphia, along with their ability to advocate for themselves.
Improving Services and Representation Where They’re Needed Most
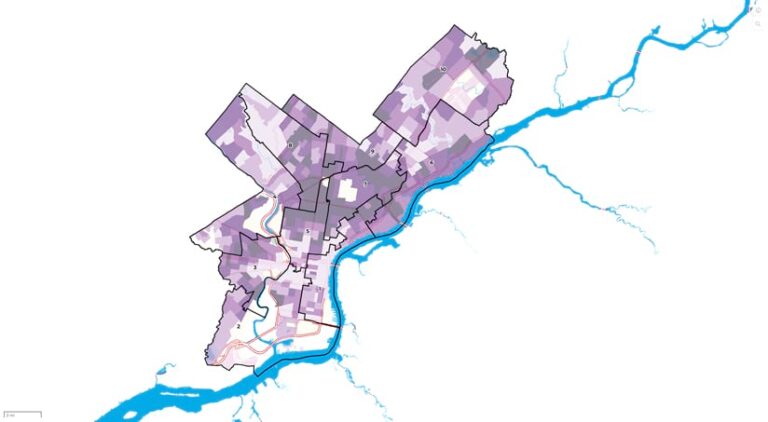
The map, known as the Disability Representation Map, is available at links.esri.com/PhillyMap. Created using ArcGIS Online, ArcGIS Pro, ArcGIS Instant Apps, and ArcGIS Living Atlas of the World, it visually represents populations and provides a written summary of people’s disability status, age, race, national origin, and gender. Its geographic overlays include census tracts, neighborhoods, ZIP codes, city council districts, Pennsylvania House and Senate districts, and US congressional districts.
It also shows a broad range of results. For example, the percentage of Philadelphians with disabilities ranges from less than 10 percent in some neighborhoods to as high as 40 percent in others.

Many Philadelphia city departments have used the map to help make city services more equitable and accessible in projects related to hazard mitigation, recreation, mobile libraries, outdoor dining areas, sidewalk curb grading, signage, and more. As Esri senior accessibility project manager Jessica McCall explained, “The map helps city leadership make better-informed decisions on where to locate essential services and support for specific communities.” The map has also been useful in city grant applications; emergency planning; efforts to increase disability awareness; residential outreach and engagement; and compliance with the Americans with Disabilities Act of 1990, which prohibits discrimination based on disability.
For Philadelphians with disabilities, the map also represents a leap forward in representation and empowerment. For example, a Philadelphian with a disability can look at the map, read a written summary about a specific area, and then advocate for more services based on the data. According to Warner, “With this map, a disabled person can go to their councilperson or another elected official; show them the data; and say, ‘These are your constituents. What are you going to do to improve their lives?’ I think that’s one of the most beautiful things I’ve encountered in this project.”
Making Maps More Accessible
While the map was launched in 2022, in 2023 it was overhauled to improve its accessibility. This is when the US Access Board got involved, advising the Philadelphia project leaders and Esri on best practices for accessible design.
An independent federal agency that promotes equality for people with disabilities, the Access Board provides leadership in accessible design and developing accessibility guidelines and standards. The Access Board and the Esri accessibility team worked with the City of Philadelphia and dozens of Philadelphians with disabilities to make the map as accessible as possible and to help improve ArcGIS accessibility standards. The upgraded map uses colors that are most likely to be clear to individuals with visual disabilities. It even has a monochromatic layer for people who have monochromatic color blindness.
It was one of the first maps to use Esri’s Enhanced Contrast basemaps to improve accessibility, Warner said. “A lot of GIS professionals, myself included, are not accessibility experts,” he explained. “With census data and this basemap, anybody can make a map like this now.” Keyboard navigation options, thoughtful symbology, and a separate QR Code are other tools that support use of the map by people with disabilities.
Bringing Builders and Dreamers Together
Nieves noted the power of a solution that is not only built for a specific group but also by that group.
“Daniel and I are both disabled,” Nieves said, noting that they have different skill sets that allow them to approach projects creatively, innovatively, and in a way that is centered on equity. “This is what happens when you empower employees to lead through their intersectionality. Philadelphia has made incredible progress in justice, accessibility, and engagement for the disabled community in the last few years. We can’t erase the harm of the past, but we can strive for a more equitable future, and the map is key to doing this. The map has been connected to millions of dollars in equity-based grants for the city and is being leveraged when creating new projects and programs. Even policies and legislation are shifting. The map’s impact has been astronomical in helping us shift dialogues and move up timelines.”
Referring to Warner, McCall, and herself, Nieves said, “When you bring builders and dreamers together to solve a problem, it opens up a wealth of information for everyone else.”
Looking forward, Warner and Nieves said that Philadelphia, with Esri’s help, will continue to improve the map’s ease of use for the disabled community—an effort that has much broader implications. “GIS unlocks so much, whether it’s bird migration patterns, lava flows, or addressing poverty,” Nieves said. “I want to see more people with disabilities and young people starting to get excited about what they can do and learn so that they can bring together ideas and technology to look at problems through a different lens. And if we can commit to producing fully accessible maps, and we ensure that we are including this demographic within that space, I think we can change the world.”
McCall and the rest of the Esri accessibility team agree. “Improving accessibility requires a lot of forethought and effort,” McCall said. “It takes inclusive thought and work, and a lot of time and research. It’s why I always point out that accessibility is a journey, not a destination.”

