The new Landsat Explorer web app from Esri enables users to wield Landsat imagery to explore geology, vegetation, agriculture, and cities anywhere in the world. The app, driven by publicly accessible image services, offers a way to better visualize the planet and understand how the earth has changed over time.

Using the app is simple: Open it in a web browser, search for a location, and apply analysis tools on the fly to get immediate, dynamic results. With no download required, Landsat Explorer users get instant, interactive access to an extensive collection of multispectral, multitemporal Landsat imagery.
Landsat satellites have been collecting information about the earth’s surface for almost 45 years. Each Landsat image contains multiple bands of spectral data gathered at different wavelengths. More than just offering pictures of the planet, Landsat’s different bands can be combined and analyzed to learn about what is happening on the ground, beyond what the eye can see.
Landsat Explorer is powered by Esri’s Landsat image service, which includes more than 500,000 Landsat scenes with over 500 new scenes added daily. This is made possible in part by Amazon Web Services (AWS) and its Landsat on AWS dataset, which hosts Landsat 8 scenes (from 2013 to present) for free. Esri’s Landsat image service combines this massive Landsat 8 collection with the Landsat Global Land Survey (GLS) datasets from 1975, 1990, 2000, 2005, and 2010. The result is four decades of global coverage. And while the Landsat Explorer app is a simple way to interact with this dataset, the Landsat image service can also be used directly in a wide range of other Esri apps and software, including ArcGIS Pro.
Beyond enabling users to instantly view half a million Landsat images using different band combinations or enhancements, Landsat Explorer offers extensive analytical capabilities. The visualization and analysis tools let users do the following, all on the spot:
- Visualize the data using custom indexes and band combinations
- Filter and select specific dates to analyze and compare
- Interactively compare two images using a swipe tool
- Create custom masks
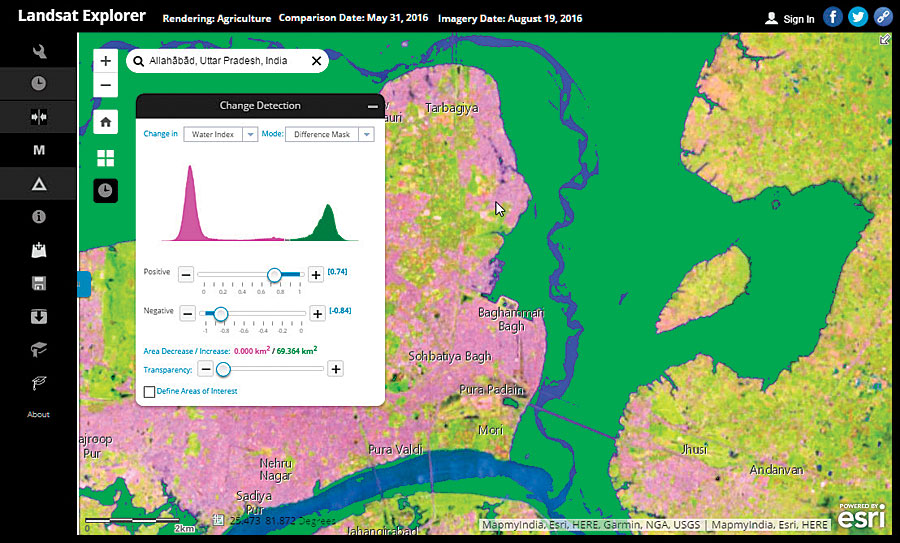
- Perform change detection
- Generate spectral and temporal profiles
- Create scatterplots using spectral bands
- Add data (city roads, for example) from ArcGIS Online
This means that users can calculate the Normalized Difference Vegetation Index, or NDVI (which employs different spectral bands to indicate the presence of healthy green vegetation), on demand anywhere in the world. They can also compare NDVI values at two points in time, visualizing increases or decreases in NDVI as they pan and zoom. To get a better idea of how to employ all the app’s tools, users can check out the included tutorial, which exhibits the app’s full capabilities.
Users can apply Landsat Explorer’s analysis tools in myriad ways. Perhaps a user is curious about how her hometown has expanded since childhood. To find out, she can zoom to her hometown and use the app’s time slider to dynamically compare before and after images. Maybe a student would like to quickly quantify areas of agriculture usage or forest burn. He can use the Mask tool to identify specific types of land cover, like farmland, and interactively set thresholds to increase the results’ precision. Additionally, a journalist might want to measure the extent of a flood, such as the one that occurred in Allahabad, India, in 2016. She can quickly find the answer by selecting images before and during the flood and then using the Change Detection tool to highlight the affected areas. If the journalist then wants to share her discoveries, she can save her results to ArcGIS Online or as a local file.
Landsat Explorer also serves as inspiration for users who want to develop their own apps to engage with imagery. Landsat Explorer is open source, developed using ArcGIS API for JavaScript, so interested developers can find more information here about building similar apps. Users who want a more supported experience can create similar imagery apps using Web AppBuilder for ArcGIS and its wizard-like, what-you-see-is-what-you-get interface in conjunction with the Web AppBuilder for Image Services (WABIS) add-in widgets.
Landsat Explorer joins Esri’s existing suite of Landsat apps, including the Landsat Arctic and Antarctic Apps. Whether users answer their own questions by applying Landsat Explorer’s powerful analysis tools or take the small leap to create their own imagery apps, it’s never been simpler to instantly visualize and dynamically analyze the earth’s surface.