A profound change is taking place in how local municipalities, state and federal agencies, and other organizations prepare for and respond to disasters. Instead of shifting from everyday operations into emergency mode, in which real-time collaboration and communication with the public suddenly become critical, they are being more proactive, employing Web GIS before, during, and after disaster situations to unite their daily operations with emergency needs and foster ongoing cooperation.
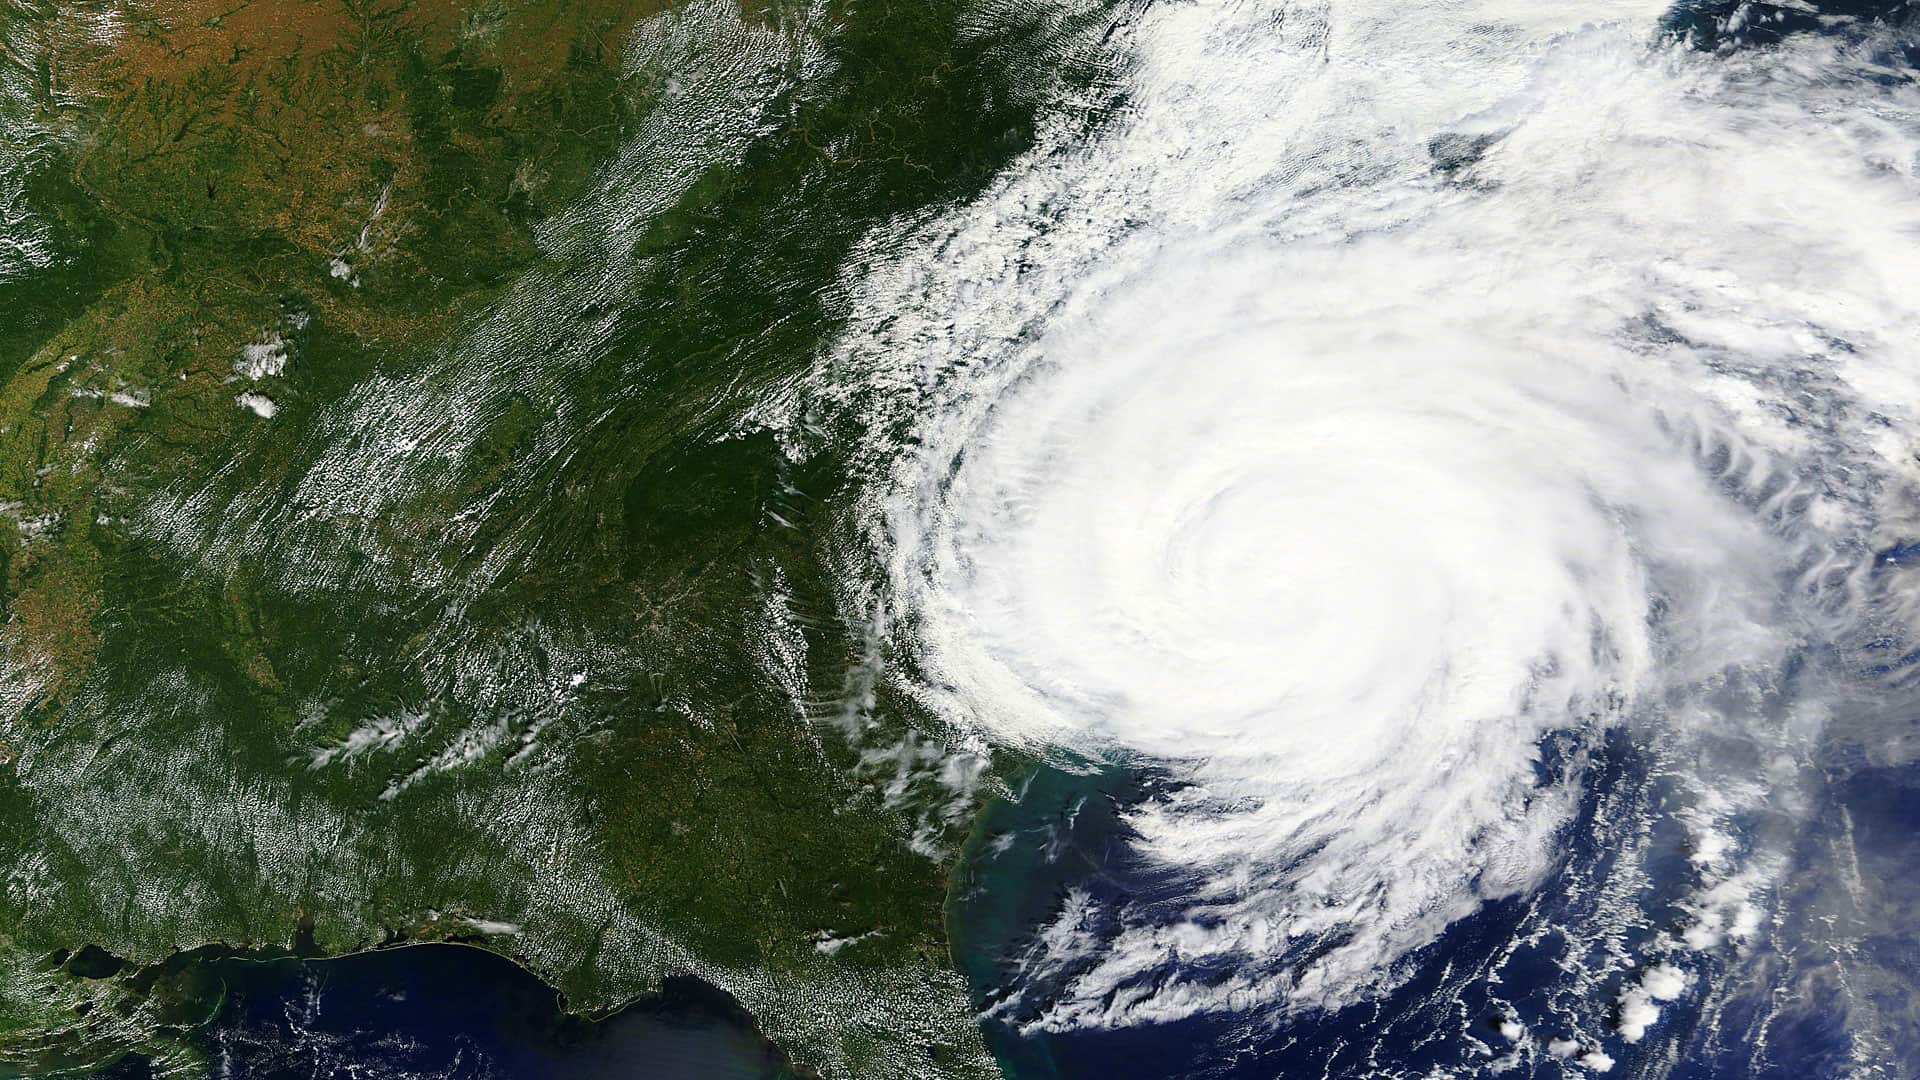
As Hurricane Florence barreled toward the eastern United States in mid-September 2018, the City of New Bern, North Carolina; the South Carolina Emergency Management Division (SCEMD); and nonprofits including the National Alliance for Public Safety GIS (NAPSG) Foundation and Humanity Road were as ready as they’d ever been to take a direct hit. In large part, that’s because they already had scalable and dependable Web GIS configurations in full use.

“Web GIS has progressed to an operational capacity so powerful that organizations can take advantage of it right away, deploying apps to first responders and citizens as soon as the infrastructure and processes are there,” said Ryan Lanclos, Esri’s director of public safety industries. “Being prepared for the next thing that’s coming—whatever that incident might be—is critical to execute an effective response and recovery. We saw a lot of people proactively taking measures to do that in the lead-up to Hurricane Florence.”
The next event always comes sooner than anyone anticipates, so baseline readiness is paramount. Here’s a look at how New Bern, SCEMD, NAPSG Foundation, and Humanity Road leveraged the power of Web GIS—including new special emergency management solutions from Esri—to direct their response and recovery operations in very effective ways.
Ready for Water Rescues and Quick with Damage Assessments
Located near the coast at the confluence of two rivers—and about 90 miles from Hurricane Florence’s point of impact—New Bern had prepared for big storms before. Two years prior, when Hurricane Matthew, initially a category 5 storm, was forecasted to roll through the Carolinas, the city set up Esri’s Damage Assessment configuration on Collector for ArcGIS to help emergency responders keep tabs on field resources and conduct damage assessments. But Matthew turned back into the Atlantic Ocean after making brief landfall as a category 1 storm in South Carolina, and New Bern was spared. It was clear this time, however, that the city wouldn’t be so lucky.
“When we heard that Florence was coming and we knew how bad it was going to be, our first thought was to evacuate,” said Alice Wilson, New Bern’s GIS manager. “But then we knew some of us had to stay here to help the people who stay behind.”
City officials set up an emergency operations center (EOC) the day before the storm hit. Wilson and her team tested all their geospatial tools ahead of time, including the Damage Assessment configuration that emergency responders would use out in the field and Operations Dashboard for ArcGIS, which teams in the EOC would employ to oversee operations. They also wanted to be able to provide the Federal Emergency Management Agency (FEMA) with as much information as possible as quickly as possible.
“We knew, based on our elevation data, [which] areas would be affected,” said Wilson.

City officials also knew from Hurricane Irene in 2011 that the Neuse and Trent Rivers that surround New Bern could swell up to seven feet, if not more. Wilson pulled stream gauge data into ArcGIS Desktop so staff in the EOC could monitor the rising rivers. They readied for water rescues.
“We’d put a mandatory evacuation in place, but people stayed for one reason or another,” said Wilson.
When Florence hit the afternoon of Friday, September 14, it was an immediate impact. The rivers swelled by 10 feet.
“We were getting call after call for water rescues,” she said. “People were calling telling us they were in their attics and needed to be rescued.”
By 11:30 p.m. that night, staff at the EOC were aware that about 150 people needed to be rescued, according to the City of New Bern’s Twitter account. But that was only half of what was to come.
“We got through our stuff and then got a call Sunday morning at 1:00 that [the neighboring town of] Pollocksville needed water rescues,” said Wilson.
Rescue teams from New Bern weren’t familiar with Pollocksville, though. At one point, the fireman in the EOC said his water rescue crew couldn’t find high ground. So Wilson used GIS data from North Carolina’s statewide GIS advisory group and found contour lines for Pollocksville. She employed ArcGIS Desktop to map where that crew was and where it needed to go. Staff in the EOC then used walkie talkies and cell phones to direct the team to higher ground.
“We conducted over 300 water evacuations,” said Wilson, “and not even just in our city.”
Using data from ArcGIS Living Atlas of the World and local information, such as where street closures and shelters were located, Wilson and her team created online, public-facing maps as well. They posted a tabbed story map on the city’s website that showed stream gauges, wind velocity, and more information about Florence’s sheer potency. They also have a live app that displays all the power outages in New Bern in real time, which proved crucial during the storm, saving city staff untold amounts of time answering phone calls from residents asking about outages.

Without question, we just knocked it out of the ballpark and not only helped this city but also helped neighboring cities that didn’t have what we have. Hopefully now we can plan a little better when we rebuild.
The whole time, Wilson manned two computers: one that showed a map of New Bern in ArcGIS Desktop and one that pulled the online maps and apps she and her team had built into a dashboard that everyone in the EOC could see on a big monitor.
“It was pretty chaotic, but we tried to make sure we had as much information as possible as Florence came in,” said Wilson.
The storm passed through on Sunday, September 16, and the City of New Bern immediately began doing damage assessments using the Damage Assessment configuration it had set up in Collector. Utility workers, firefighters, and inspectors—from both New Bern and outside cities—jumped in to help.
Some of them had never used Collector before, let alone the Damage Assessment configuration, so Wilson and her colleagues trained them quickly and sent them into the field. Utility workers went first to the houses they knew had been completely inundated by water to see what they would need to do to restore service. Firefighters and inspectors went out in pairs to examine any fire concerns and record all the destruction using the app.
“We had significant damage,” said Wilson. “The storm surge affected us the most.”

In addition to the heavy flooding that deluged some parts of town, New Bern had four feet of water inside its historic downtown buildings. Big bear statues that usually stand outside certain businesses were floating down the street. And a few yachts ended up landbound, stranded next to houses and even a hotel.
By the following Friday—just seven days after Hurricane Florence hit—New Bern had finished its damage assessments.
“All the houses that were really damaged fell right where we thought they would,” said Wilson. “So we knew our data was good.”
Inspectors recorded an estimated $100 million of losses to both commercial and residential properties. Although that number is breathtaking—especially for a city of 30,000 residents—Wilson was impressed by how fast New Bern recorded this much damage.
“I was here when we had Hurricane Irene, [which] was probably the worst hurricane that I’ve been a part of,” said Wilson. “Back then, inspectors would use these forms that were FEMA generated, and they would go handwrite all this information. They would bring it back to me, and I would have to enter it all. It was so time-consuming. You were trying to read somebody’s handwriting, and after a while, they would just scribble something because they were so tired.”
The Damage Assessment configuration, which works on both Collector and Survey123 for ArcGIS, is so much faster, according to Wilson.
“Because it’s spatially located, I don’t have to do anything,” she said. “We were sharing this live. We [didn’t] have to process it and turn it around.”
As of that same Friday, FEMA was already aware of New Bern’s damage assessment values.
“I can’t even think of the amount of time we’ve saved,” said Wilson. “Esri tools…have been instrumental in getting us back on our feet.”
With only a few injuries and no deaths recorded in New Bern due to Hurricane Florence, Wilson said she has never been prouder of her community.
“Without question, we just knocked it out of the ballpark and not only helped this city but also helped neighboring cities that didn’t have what we have,” said Wilson. “Hopefully now we can plan a little better when we rebuild.”
A Changing Storm Leads to a Surprise Flood Event
When Hurricane Florence set in on South Carolina, Charlie Kaufman, the GIS manager at SCEMD, was well equipped to be agile.
“South Carolina Emergency Management as a whole is a support agency for county and local governments,” explained Kaufman, who is essentially a one-man GIS shop. “My role as the GIS manager for the emergency management division is making GIS products to support not only agencies that are assisting at the state level but, if I can, also making GIS products that can support counties.”
The products he puts together range widely, from hundreds of GIS layers and web apps to dashboard-based situation reports and predictive flood models. For Hurricane Florence, this array of GIS proved indispensable, since over the course of just a few days, the nature of the storm changed several times, affecting everyone’s response operations.

“We initially thought a category 4 storm was going to broadside us,” said Kaufman. So South Carolina governor Henry McMaster ordered a mandatory evacuation for several coastal counties. He encouraged people to go to SCEMD’s Know Your Zone web page to determine if they were likely going to be affected by the storm surge.
“Our hurricane Know Your Zone website really got engaged,” recalled Kaufman, who used ArcGIS Online to host the map. “My final tally for that was I had over 900,000 views on it.”
At this point, SCEMD began planning search and rescue and life safety response operations. Kaufman readied his search and rescue grid map. He also used Web AppBuilder for ArcGIS to make web maps that first responders could take out into the field and use on their tablets and smartphones.
“We have a statewide common operating picture…that’s already in a web application that we use to monitor disasters all the time,” explained Kaufman. “I have about 300 GIS layers ready to go so I can create offshoots of that on the fly if I need to.”
Although a lot of water dropped in South Carolina when Florence made landfall, it didn’t end up being the category 4 storm SCEMD had been expecting. While emergency responders commenced operations as soon as the wind stopped blowing, some of the people who had evacuated started to come back, thinking that all threats from Florence were over. But then the rain didn’t stop, and a lot of the water that deluged North Carolina headed south. That’s when the rivers started to rise.
“It turned out to be a flood event,” said Kaufman. “We weren’t expecting that much rain, so the flood event was a surprise.”
The response was protracted, which required continued collaboration across several agencies. Kaufman built internal daily situation reports in Operations Dashboard and sent them out to everyone involved in the response so they could get an overview of what was going on.
“That had county closures, shelter numbers, [and] a quick weather radar of significant events that were happening in the state,” he explained. And it was just a modified version of the standard daily situation report SCEMD sends out on “blue-sky days,” when no emergencies are taking place, so it was easy to get up and running because people were already well-versed in using the app.
We’re getting better every time we do this, with practice—though we wish we didn’t have the practice.
Kaufman also used flood models from the Department of Natural Resources, the National Guard’s data and briefing maps, and his own web apps and maps to layer all this information and get an idea of where floodwaters were predicted to rise and fall. This helped all responding agencies allocate resources appropriately.
“The flood covered a large area, so they worked downriver as it [developed], trying to stay ahead,” said Kaufman. “The National Guard sandbagged highways, trying to keep some of them open. The coast guard was out there with police and other law enforcement doing rescues, too.”
While many search and rescue crews do still request paper maps from Kaufman (which he gladly supplies and updates to keep response efforts moving forward), he did see an uptick in use of his Web GIS products during Hurricane Florence. The search and rescue grid app, for instance, got more than 500 hits. And the Florence imagery viewer, which Kaufman built using photos from the Civil Air Patrol and the National Oceanic and Atmospheric Administration (NOAA), received several hundred hits, too.
“We’re getting better every time we do this, with practice—though we wish we didn’t have the practice,” said Kaufman. “The mapping products are getting better, people are able to better use the products out in the field, and they’re asking better questions of what they want. […] ArcGIS Online is getting better, so are REST services. You can pull NOAA weather feeds in [and] you can give them weather maps [as] web maps or hard copy.”
Ultimately, said Kaufman, he was able to give emergency responders better data, allowing them to make better decisions.
Creating Real-Time Common Operational Pictures
While local municipalities and state agencies throughout the Carolinas did what they could to mitigate injuries and damage from Hurricane Florence, two remarkable nonprofits—NAPSG Foundation and Humanity Road—employed GIS to give search and rescue crews, emergency managers, and evacuated residents a real-time picture of what was happening on the ground. With Web GIS at the center of their workflows, both organizations were able to map crowdsourced photos and share critical, on-the-ground information with people who needed it.
“Photos are worth a thousand words, but putting a photo on a map makes those thousand words actionable,” said Paul Doherty, program manager at NAPSG Foundation.

As just one part of its larger mission to incorporate geospatial technology more deeply into public safety and emergency preparedness, NAPSG Foundation partnered with another nonprofit, GISCorps, to stand up an Esri Story Maps app with crowdsourced photos from areas affected by Hurricane Florence.
“Across the entire impact area, there’s no single place to go to find images of what it looks like on the ground. But it’s not as simple as just putting a story map out and hoping people will add photos,” explained Doherty. “The general public is hopefully out of the affected area and is not going to take the time to add a photo. But reporters and first responders are posting photos to Twitter and Facebook—they’re just not georeferenced. So if you’re an emergency manager, those photos slip through the cracks. They never get mapped. GISCorps [volunteers] look at the photos and say, ‘there’s a street address, a business name, a street name,’ and they put that [photo] on the map.”
With this resource, search and rescue teams were able to see the conditions they were about to head into. And when FEMA was trying to figure out if certain shelters got flooded, staff were able to check the story map to see images of each location.
Just as photos get lost in the fray during an emergency, so does valuable information, such as where shelters are located or whether there are communication outages.
“Sometimes the public doesn’t know where to go for official information because the event is so large and moves so fast,” said Cat Graham, the chief operations officer of Humanity Road, which sends out reports during disaster situations that list local officials; websites that display power outage information; and the status of local hospitals, airports, and other critical infrastructure. Not only does this help the public navigate events like hurricanes, but it also assists aid agencies as they prepare to service those areas.
“Many people don’t realize that power companies are mandated to provide a public power outage map, but communications companies are not. So it becomes challenging to get information,” continued Graham. “We wonder, are we not seeing cries for help because there are none or are we not seeing cries for help because there’s no communication in that area?”

Photos are worth a thousand words, but putting a photo on a map makes those thousand words actionable.
To help fix this problem, the US Coast Guard activated Humanity Road for Hurricane Florence to provide a live strategic map of search and rescue requests emerging on social media—a first for disaster-related digital deployments. Humanity Road’s diverse group of volunteers scoured social media feeds from about 700 cities and 30 counties for hashtags and keywords such as “help” and “I’m trapped” to identify legitimate requests for assistance. Meanwhile, two US Coast Guard Academy cadets, Reid Wiegleb and Evan Twarog (who were volunteering with Humanity Road) built geospatial information products, including a heat map—hosted in ArcGIS Online—of rescue requests that coast guard command centers were able to consume. This gave decision-makers and first responders a common operational picture of what was happening on the ground so they could position assets effectively.
“You might have seven different teams doing seven different tasks,” said Graham. “When you get all those seven together and you can make a common map, you get a beautiful picture of exactly what’s happening on the ground.”
Both nonprofits want to see local, state, and federal organizations use geospatial information and GIS more robustly during nonemergencies as well so they can be ready to use it when disaster does strike.
“Geospatial information and tools are no longer a nice-to-have for public safety agencies,” said NAPSG Foundation executive director Peter O’Rourke. “It will absolutely change the decisions [being] made if you use it on an ongoing basis.”