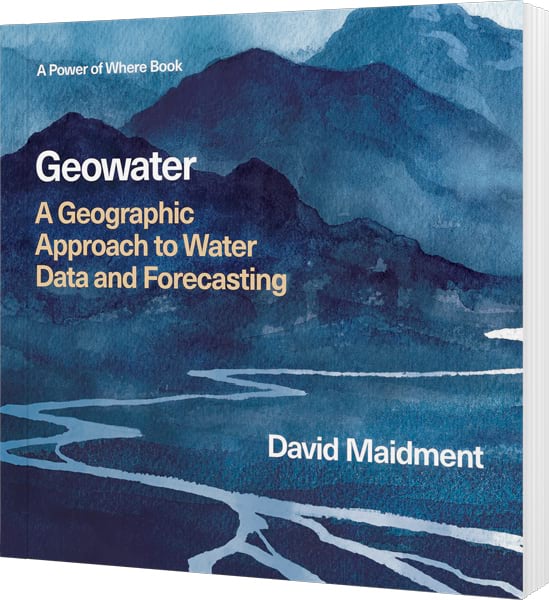
Geowater: A Geographic Approach to Water Data and Forecasting
By David Maidment
Geowater asks readers to rethink how we use data and technology to confront water scarcity, flooding, and environmental change. By linking global processes to local consequences, hydrologist David Maidment shows how applying the geographic approach to water is key to building a more resilient future. In this excerpt from the book, explore the challenges and powerful solutions at the heart of how we understand, model, and manage one of Earth’s most vital resources.
The Geographic Approach to Water Forecasting
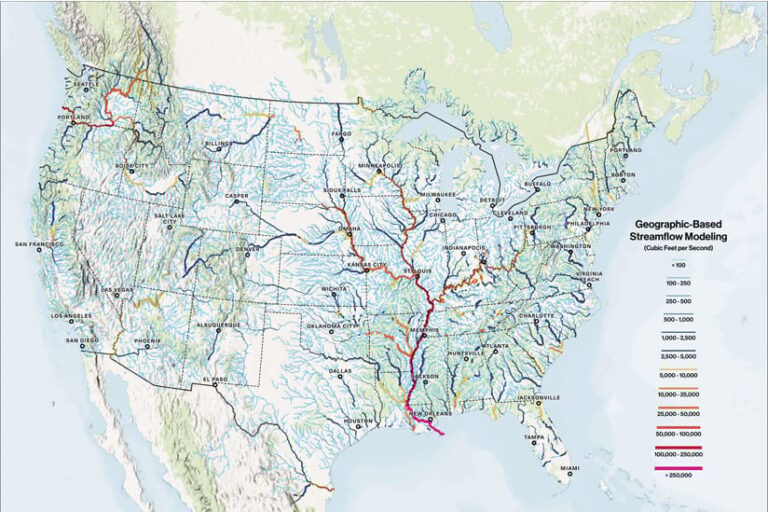
Forecasting water flow in streams and rivers today has become as ubiquitous as weather forecasting—available everywhere, all the time. It wasn’t always that way, but in 2015 a new National Water Center opened on the Tuscaloosa campus of the University of Alabama. The National Weather Service established the center to provide a national focus for water forecasting in the United States. A year later, the release of the nation’s first National Water Model allowed the National Weather Service to continually forecast water flows that eventually covered 3.2 million miles of streams and rivers in the continental United States.
Fast-forward to early April 2025: When rain-swollen floodwaters swept across swaths of the Midwest and South, the National Water Prediction Service published flood inundation maps on its website that went viral, with more than 20 million hits per day. With those maps, real-time flood information had entered the public consciousness.
Just three months later, on the Fourth of July, 2025, a devastating flood struck the Guadalupe River in central Texas as dawn approached. In 90 minutes, water levels rose more than 32 feet where the river runs through Kerrville in the Texas Hill Country, northwest of San Antonio. The flooding killed more than 130 people, including many children at a summer camp along the river. The tragedy showed that flood maps by themselves are not enough to save lives. People in the path of floods also must receive warnings and other information derived from these maps quickly so they can escape danger in time.
We still face many challenges when it comes to communicating flood forecasts in a timely and accurate way. However, the transformative story of how we forecast and model water flow would have been almost inconceivable a decade ago. How did these advances come about? What do they mean for the future? I was engaged from the beginning in these developments, so I’d like to describe what has happened, and what I see going forward.
The US National Water Model
The National Water Model is built on a foundation of geographic data to describe the connection between land and water systems as precipitation falls and becomes streamflow. Although large-scale floods are regional in extent, their consequences are local and personal. Homes are washed away, cars are swept downstream, lives are lost. The ability to relate cause and effect in such events requires us to connect information geographically across a wide range of spatial scales. In addition, web communication must inform the public about the current extent of flooding and what to expect in the near future.
These tasks call for a geographic approach to water as described by Esri cofounder and president Jack Dangermond in his 2024 book, The Power of Where. As Jack explains, the geographic approach centers on the question of how to put the geographic factors that define Earth’s systems into a computer so that we can see problems as relationships between phenomena. By visualizing and modeling these relationships, we can harness the computer and evolving technologies such as AI to compare vast amounts of data, make predictions, and reach new understandings to drive the smartest approaches to planning, design, and environmental protection.
GIS organizes and integrates all kinds of data and supports mapping and virtually all human activities with analysis, models, and maps full of information to transform how we address challenges and act responsibly. Within this context, water is a vast subject, vital to life, dynamic over the globe, and almost infinite in its scope and complexity.
Geowater does not attempt to tell the full story of all aspects of water but rather serves as a companion to The Power of Where and more specifically as a case study for the application of the geographic approach to water data and forecasting.
More from Esri Press
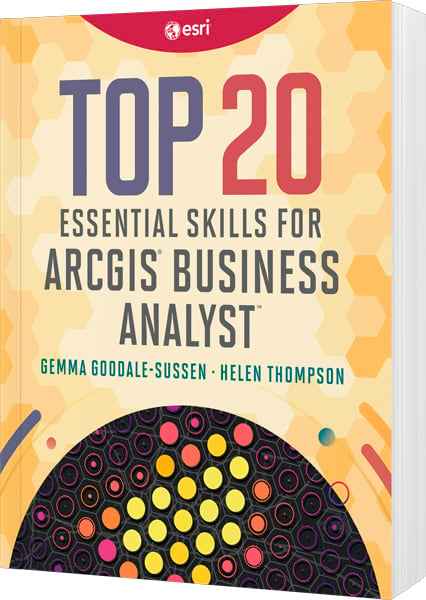
Top 20 Essential Skills for ArcGIS Business Analyst
By Helen Thompson and Gemma Goodale-Sussen
Learn how to use the world’s premier data analysis software to make smarter decisions about site selection, gain insights into potential customers, easily visualize your location-based data, and more. September 2026, 268 pages.
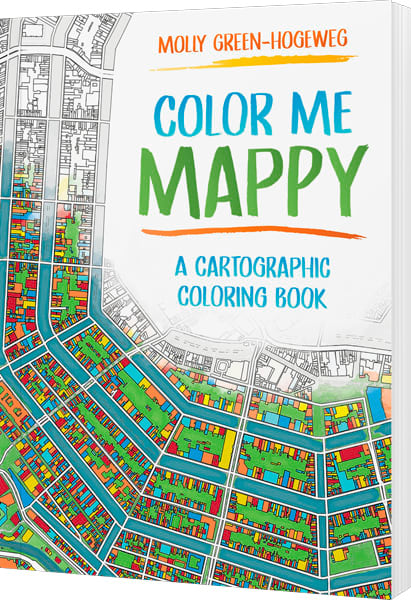
Color Me Mappy: A Cartographic Coloring Book
By Molly Green-Hogeweg
Color Me Mappy combines the beauty of cartographic detail with the joy of creative exploration, inviting you to interact with maps in a hands‑on way. September 2026, 80 pages.
Exploring GeoAI: Tools and Workflows
By Ismael Chivite, Nicholas Giner, and Craig Carpenter
Learn the latest geospatial AI models and tools with Exploring GeoAI. This essential guide empowers readers with the practical skills to implement GeoAI and efficiently automate, predict, and optimize their work. August 2026, 168 pages.