Since its inception 10 years ago, a North Carolina network of gages that collect rain and stream flow information has evolved into a sophisticated system of gages and integrated technologies that collect, analyze, map, and communicate flood hazard extent and estimated damage in real time through a powerful web interface.
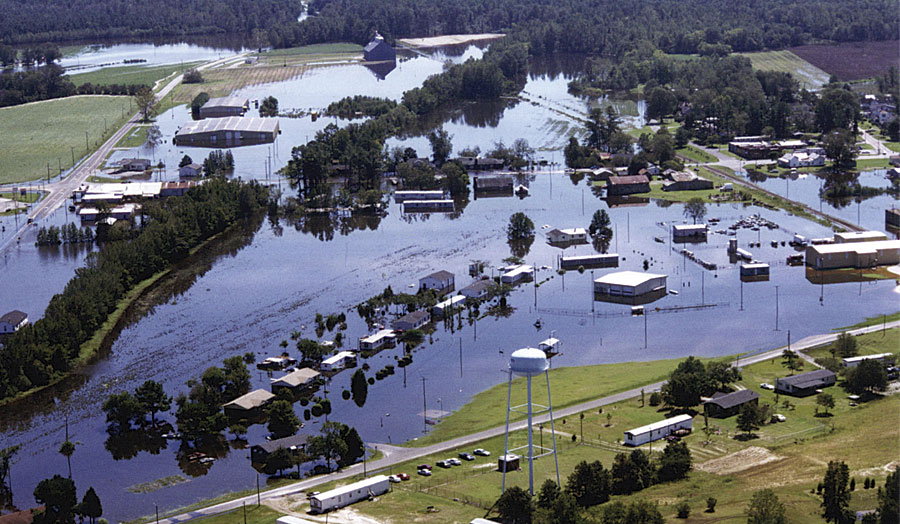
North Carolina established the North Carolina Floodplain Mapping Program (NCFMP) to better identify, communicate, and manage risks from flood hazards within the state in response to the devastating flooding caused by Hurricane Floyd in 1999. This led to the establishment of the Flood Inundation Mapping and Alert Network (FIMAN) to provide real-time flood information throughout North Carolina.
FIMAN is a unique component in NCFMP’s program. Whereas traditional floodplain maps are based on model simulations of probabilistic storm events, such as a 100-year storm event, FIMAN provides actual storm-specific rainfall and stream/flood information based on a system of measurement stations (i.e., gages) located throughout the state.
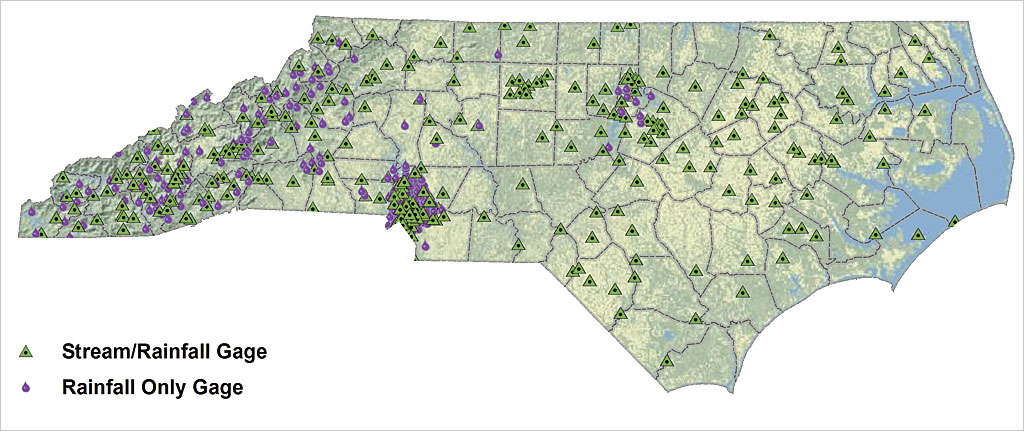
This system integrates existing gages maintained by the US Geological Survey and other agencies with state-owned gages, resulting in an overall network of approximately 550 gages. Gage readings are typically recorded and transmitted every 15 to 30 minutes. The goal of the FIMAN system is to reduce the loss of life and flood-related property damage by providing emergency managers and the public with more timely, detailed, and accurate information.
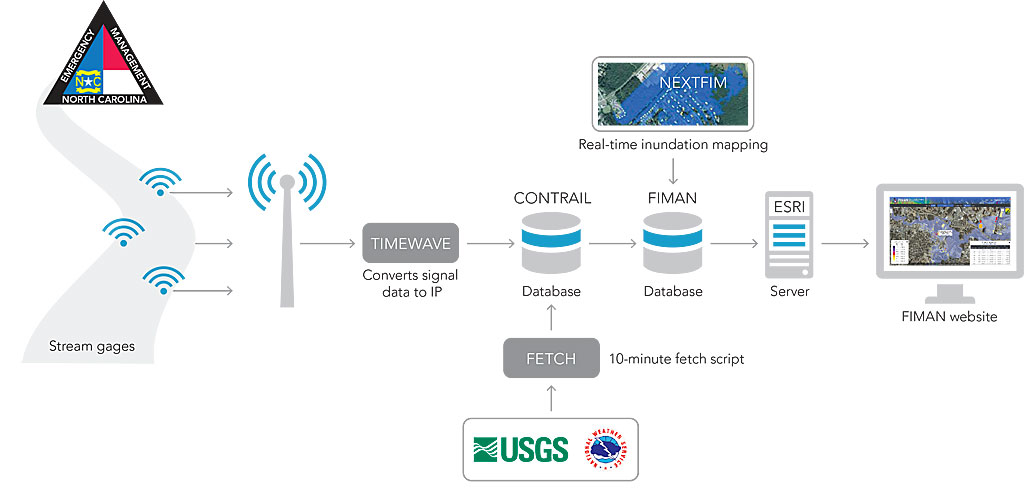
The FIMAN network utilizes multiple technologies to collect and feed real-time data to GIS servers for dissemination. Data collected at the gages through sensors is transmitted by radios or satellite, retrieved and processed by special software, and then stored into an enterprise GIS database. Custom tools then evaluate readings and assess potential flood conditions. During flooding conditions, the tools will calculate estimated impacts and send automated alerts. Esri ArcGIS for Server is used to display the locations and query real-time gages and flood impact information in a custom web application.
Determining Real-Time Flood Conditions and Impacts
One of the most powerful aspects of FIMAN is its ability to not only measure and display gage information but also analyze, map, and communicate flood risks in real time. As gage readings are loaded into the central GIS database, they are first compared with predefined thresholds and the previous readings to assign a general flood condition (major flooding, minor flooding, no flooding) and determine the trend of the flood condition (e.g., increasing or decreasing). If a gage is identified as being in a flood condition, the database runs tools to develop estimated flood inundation boundaries and compute flood impacts.
One inherent challenge with gage-based warning systems is that they only give information at the specific location of that gage. Gages are expensive to install and require resources to maintain them. If they are present at all, gages are typically located sporadically along a stream, often many miles apart.
Thus, there are often long sections of stream that may be vulnerable to flooding but for which no information is available. NCFMP uses an innovative approach for overcoming this challenge that results in the automated generation of seamless flood inundation boundaries and subsequent impact analysis between gages and along multiple streams in one process. Collectively, this set of tools used to analyze and map real-time gage readings is referred to as NexFIM.
How NexFIM Works
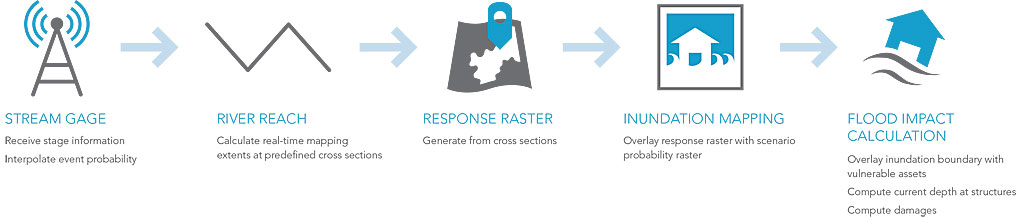
NexFIM is built on tools that leverage multifrequency flood hazard information and vulnerable asset information from the NC FLOOD and NC RISK databases that NCFMP maintains as part of its overall program. During a flood event, NexFIM algorithms calculate real-time storm event probability for each stream gage in the system. The tools then use probability raster datasets to produce real-time flood inundation layers within minutes of receiving the gage telemetry. The seamless flood inundation boundary is regenerated with every gage reading. Thus, the system has the ability to track the wave of a storm event as it moves through a river system. In addition, the tools time-stamp and archive each inundation boundary so that an overall maximum flood extent associated with a given storm event can be mapped.
Once a flood inundation boundary is developed, NexFIM tools overlay the flood inundation boundary with existing structure information (such as building type, value, and first-floor elevation) stored in the databases to identify impacted buildings and assign storm event probabilities. Estimated damage for each building is then calculated by the tool. Along with individual building depths and damages, the tools calculate rolled-up damage summary statistics for logical categories such as occupancy type, community, or stream.
Flood Warning and Impact Assessment
FIMAN is a sophisticated system of integrated technologies, datasets, and tools. However, one element that is critical to meeting the objectives of the system is the ability to effectively communicate information to emergency managers and the general public.
NCFMP has developed the FIMAN web application to view and disseminate the information. The application site uses responsive design and consistent modeling techniques, which allows it to be efficiently accessed from desktop, laptop, or any mobile device. The site also integrates common GIS base data and geocoding services as well as layers such as live weather radar feeds. The FIMAN site has two view themes—the Gage view and the NexFIM view. The view themes differ in focus and target audience, but both are accessible to all site visitors.
Gage View
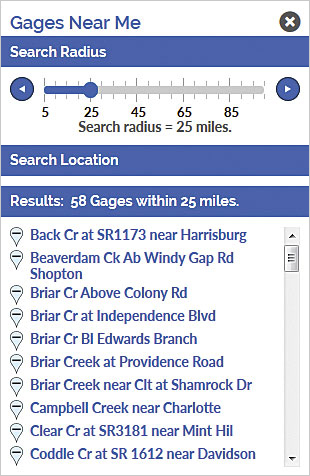
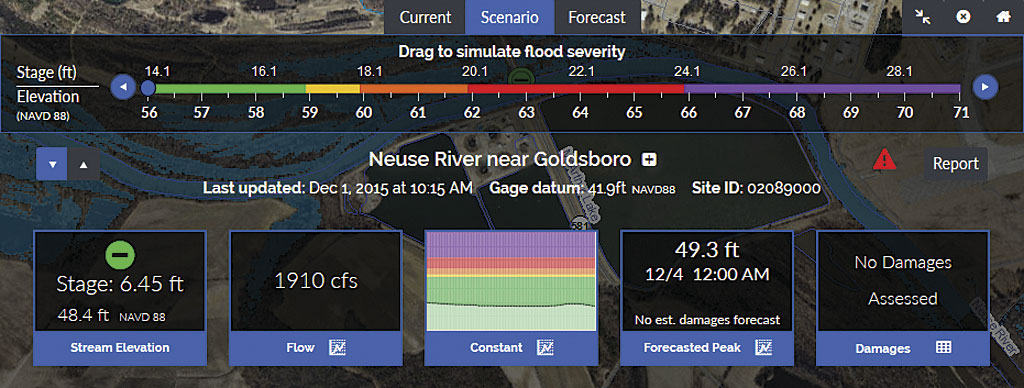
The Gage view is intended for the general public to learn about flood conditions and alerts in an area of interest. An interactive map displays pins showing the gage status and trend of all gages in the state. Users can find gages of interest using their current location, view gages within a search radius, or search by river basin or gage name. Selecting a gage displays the most recent stage, flow, and predicted risk information. Where available, forecast information from the National Weather Service is also displayed. What-if scenario tools show potential flood damage/impact estimates. For example, these tools can show what areas will flood if the gage gets to a certain level. Users can also sign up for automated email notifications when a gage of interest changes flood state.
NexFIM View
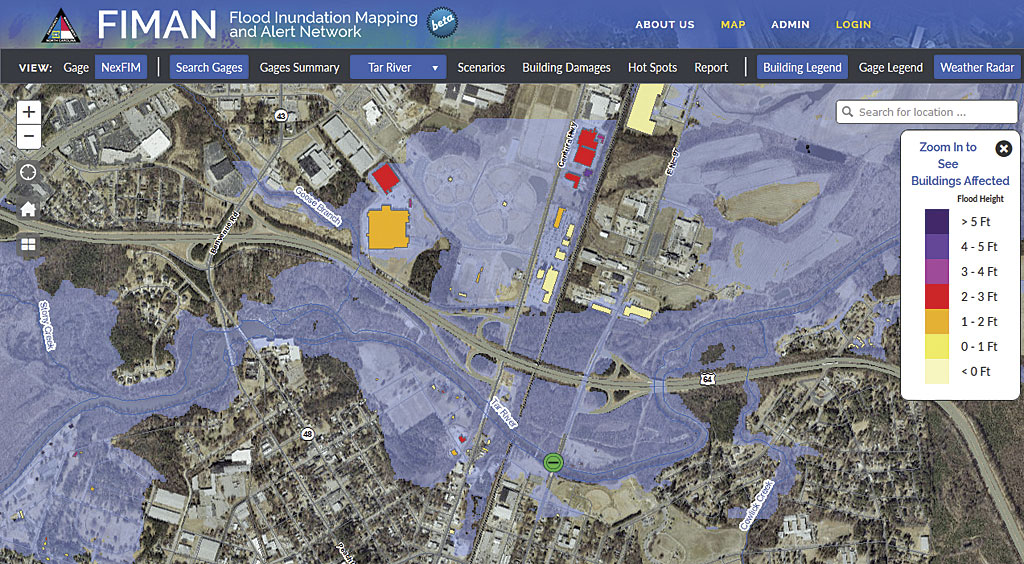
Whereas the Gage view focuses on information at a specific gage of interest, the NexFIM view provides real-time and scenario flood information for an entire river system using the NexFIM computational algorithms. Using a pull-down list, users can select a river system of interest that has been processed in the FIMAN system. The viewer zooms to the river system and displays an outline distinguishing all the gages included in the selected river system.
If gages in the selected river system are experiencing flooding, seamless flood inundation areas will be depicted in the viewer and will be updated with every new gage reading. Similar to the Gage view, the NexFIM view lets the user view information for a number of scenario storm events such as a 25-year flood event. In addition, the viewer provides flood information for select historic events, such as Hurricane Floyd, that have been processed.
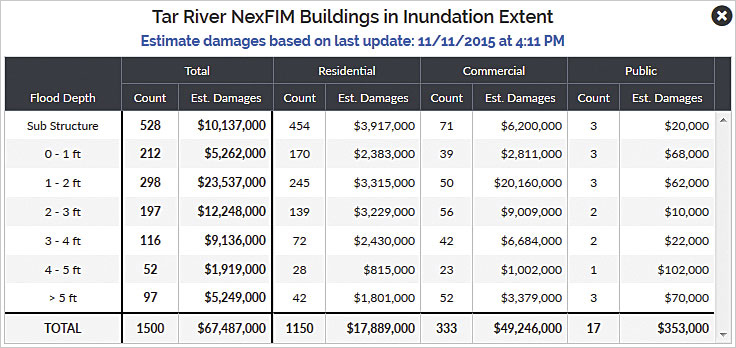
The NexFIM view also provides powerful visualization of the flood impacts by displaying impacted buildings color-coded by depth of flooding and tabulated building damage estimates. The user can click on an individual building for specific information on that building such as building type, flood depth, and estimated damages.
FIMAN in Action—Hurricane Joaquin
In the first week of October 2015, the combination of Hurricane Joaquin passing to the east and a stalled low-pressure system produced historic rainfall totals and subsequent flooding in portions of the Carolinas. The storm, which had rainfall totals ranging from 3 inches to over 20 inches over a three-day period, resulted in more than 20 fatalities and damages estimated in the billions of dollars.
Although North Carolina was spared the extreme rainfall experienced in South Carolina, the storm resulted in significant flooding along the coast and eastern counties. FIMAN was used by the State Emergency Operations Center throughout the storm to monitor flooding conditions, assess potential impacts of flooding based on weather forecasts, and target the deployment of emergency response personnel and resources. FIMAN served as an invaluable tool in communicating risk to public officials and the public.
Building on the Program
FIMAN relies on physical rain/stream gages and databases with flood hazard and vulnerable asset information to identify and communicate current and forecast flood risks. NCFMP is continuously reviewing, adding to, and updating this information. Although FIMAN contains a relatively dense network of gages, NCFMP will continue adding new gages based on identified need and available funding.
As part of its regular flood and risk maintenance, NCFMP is also collecting new data and updating flood and risk information. For example, NCFMP is currently collecting high-resolution (two points per meter) lidar for the entire state. This new topographic data will be used to verify and/or update flood and risk information. As new gages and updated flood and risk information are developed, the data from them will be integrated into FIMAN, further enhancing geographic coverage and accuracy of real-time flood information.
For more information, contact John K. Dorman or Neal Banerjee.