The ArcGIS API for Python is easy to learn and extremely useful for data scientists, GIS administrators, and GIS analysts. One of the features that makes this API so powerful is its integration with Jupyter Notebook.
Jupyter Notebook is a web-based integrated development environment (IDE) for executing Python code. Unlike other traditional IDEs that are designed for developers, Jupyter Notebook provides a simple and easy-to-use interface that encourages the Read-Eval-Print Loop (REPL) process that is central to learning how to code in Python.
This approach originated with IPython Notebook. Project Jupyter took over the open-source project and opened it up to the Julia, Python, and R languages (hence the name Jupyter). Now many more languages are supported. Because these notebooks are free, open source, and platform independent, they can be run on any device that has a browser, allowing them to be easily shared.
Python and Jupyter Notebook are immensely popular in the data science community. Jupyter Notebook combines code execution, rich text, mathematics, plots, and rich media and has become the de facto medium for teaching Python and data science at schools and in online training programs.
The interactive Jupyter Notebook environment is built around the concept of cells that can contain executable code or text and illustrative graphics written in Markdown format. Cells can be run in any order and any number of times. When a cell is run, its output is displayed immediately below the cell. This encourages tweaking and rerunning code until the perfect solution is found—illustrating the REPL paradigm in action.
Because it is a web application running in a browser, Jupyter Notebook supports the display of graphic outputs. Write a snippet of Python code to plot a bar chart of household income of a county, and the chart will be displayed right below the cell containing that code.
Members of the passionate open-source community have created extensions for Jupyter Notebook that have made it a versatile tool that can be used for a variety of tasks beyond software development, from running presentations to grading student assignments in the classroom.
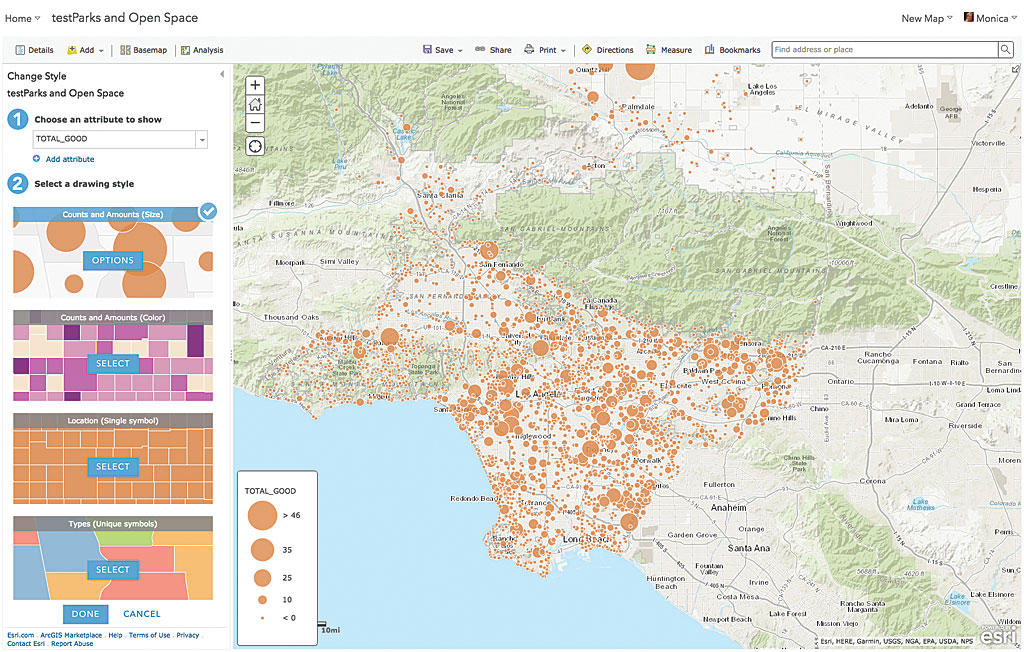
Jupyter Notebook is also a great medium to work with and explore spatial data. Using just a single line of code, a live interactive map can be inserted into a notebook. Another line of code can add content to that map that is the result of a search. That content can be added with its default symbology or—using smart mapping—the API can figure out how best to symbolize the data. SpatialDataFrame objects returned from a query for features in a feature layer can be visualized as a table in Jupyter Notebook.
The ArcGIS API for Python builds on the rich illustrative framework available in Jupyter Notebook. The API provides access to the spatial data exploration, mapping, visualization, and analysis capabilities of the ArcGIS platform. A published imagery layer can effortlessly be overlaid on the map. With support for raster functions as native Python functions in the Python API, analyses can be applied and rendered instantly on the map.
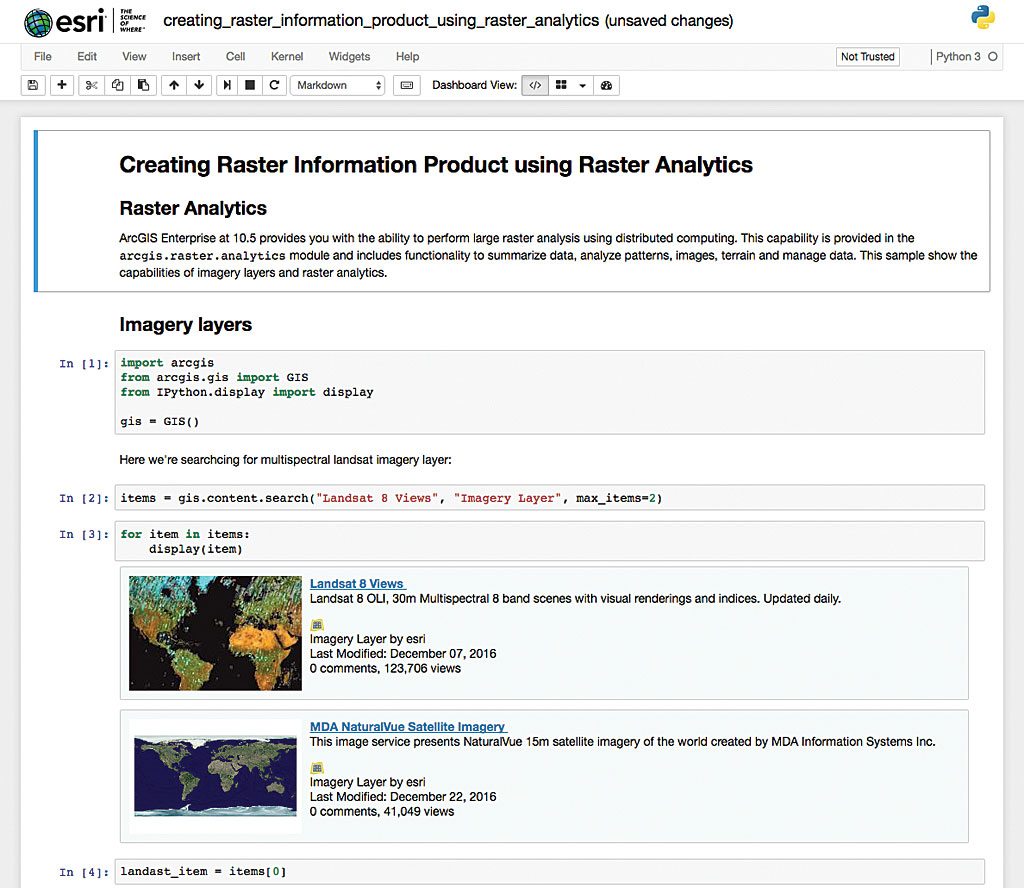
The Python API can also be used by GIS administrators to search for and display users, groups, or items from ArcGIS Online. Items will show up in rich HTML format with thumbnails and metadata information.
Jupyter Notebook is a great medium to teach not only programming but also GIS. The integrated, interactive Jupyter Notebook environment can help teach GIS concepts to decision-makers as well as new GIS users.
Workflows, data connections, outputs in the form of illustrative charts and maps, and informational text about conclusions—it can all be stored and worked with in a notebook. A Jupyter Notebook can become a functional record of a workflow that can be shared with anyone. All the recipient must do is run the cells to reproduce that workflow. Jupyter Notebook encourages research that is reproducible, since not only the findings but the code used to arrive at them is stored.
Get Started Now
To try the Jupyter Notebook live in a browser, go to notebooks.esri.com No installation or login is required. This site is a sandbox environment that is preloaded with the ArcGIS API for Python and contains guide chapters and samples in a Jupyter Notebook. Because it is a sandbox, the site resets itself after use, so any work should be saved. Saved notebooks can be uploaded and run during subsequent visits to the site.
To install and run Jupyter Notebook locally, go to developers.arcgis.com/python and follow the installation instructions. Jupyter Notebook is bundled with ArcGIS API for Python and will be installed on your computer with the API, providing access to the rich analytical capabilities of the ArcGIS platform and powerful machine learning and data analysis libraries, right from within Jupyter Notebook. The ArcGIS API for Python and Jupyter Notebook give you a whole new way of experiencing GIS.

