An interdisciplinary research and graduate and undergraduate training center studying the recovery of the New Jersey Coast following Superstorm Sandy used Collector for ArcGIS and significantly improved the efficiency of its field data collection processes.
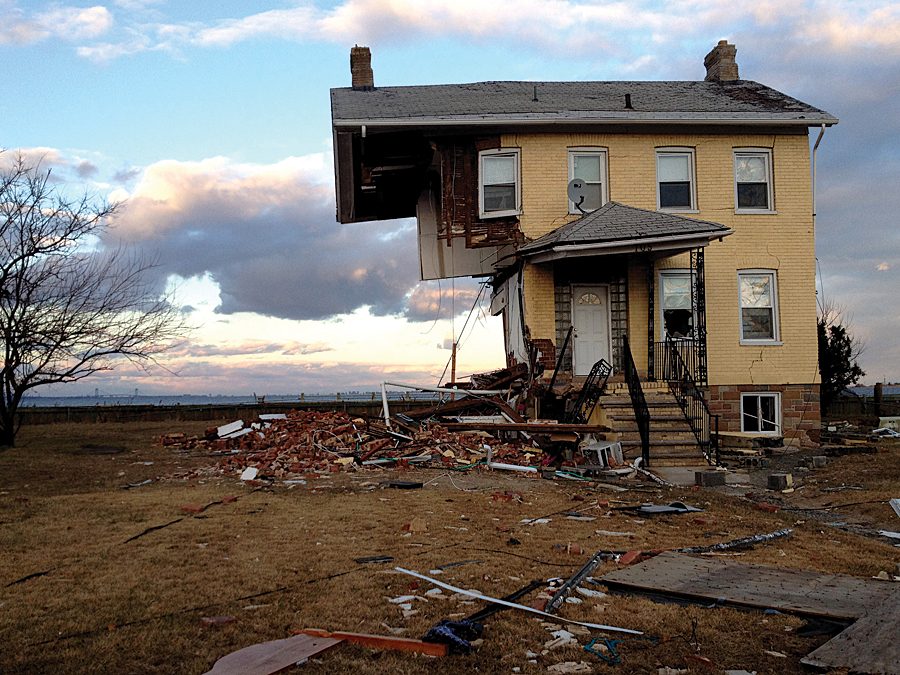
Superstorm Sandy impacted the coasts of New York and New Jersey in a fashion not seen since the 1903 Vagabond Hurricane. Storm surges of more than eight feet, coupled with more than 11 inches of rainfall and wind speeds nearing 90 mph damaged or destroyed more than 72,000 homes and businesses across the coast of New Jersey. In the blink of an eye, decades of Jersey Shore history were washed out to sea by Sandy’s wrath, leaving a swath of destruction from Sandy Hook south to Downe Township.
The process of recovering from Sandy began almost immediately with a Presidential Disaster Declaration and promises of a return to normalcy. However, the truth is that recovering from a hurricane is a long-term process. The Hazards and Vulnerability Research Institute (HVRI) at the University of South Carolina has been at the forefront of long-term recovery assessment and tracking since the catastrophe brought on by Hurricane Katrina in 2005. Its mission includes the creation of new methods and metrics to assist all levels of government with preparedness, response, and recovery from disasters.
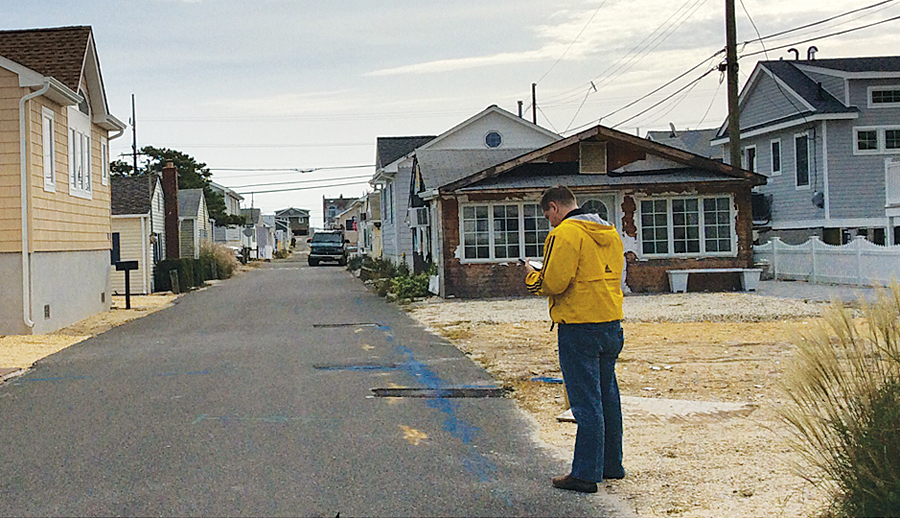
Continuing this mission, researchers from HVRI visited the New Jersey coast in recurring six-month intervals—beginning at the six-month anniversary of Superstorm Sandy in April 2013—to collect field data on the visual indicators of housing reconstruction. Field teams captured data on a sample of parcels in recovering neighborhoods and photographically documented evidence of the reconstruction progress made at each location.
This spatial data provides the empirical basis for developing neighborhood-level recovery mapping. It is the first step in answering questions pertaining to differential drivers or obstructions of recovery between places. Collecting, organizing, and analyzing a vast catalog of field recovery data is a daunting and time-consuming process that required significant coordination and personnel hours to finalize a dataset after each trip to the field.
The Shortcomings of Disconnected Data Collection
Data collected in the field included the geospatial location of each recovery parcel; photographic evidence of its recovery status; and tabular attributes of recovery at each location that indicated the numerical recovery score assigned, damage cause, for-sale status, occupancy status, and building characteristics (i.e., roof, walls, floors, foundation).
Prior to May 2014, field teams collected each piece of data separately using a handheld GPS unit, laptop computer, and GPS-enabled camera. Researchers pieced together data components post hoc in a tedious and time-consuming process that required several weeks to produce a complete dataset.
In addition, coordination between multiple offline field teams and the upkeep of collection units was difficult. HVRI’s field teams are composed of 6 to 14 researchers who collect data concurrently across the expansive study region. Methods for allocating work and evaluating data collection progress were inefficient and sometimes resulted in miscommunication, unsystematic routing, duplication of work, and inconsistent or incomplete recovery data.
A New Approach to Mobile Data Collection
Given these challenges, HVRI identified the need for a coordinated approach to field data collection. The institute believed that Esri’s Collector for ArcGIS app presented an integrated mobile solution that would help reduce the inefficiencies of disconnected data collection. As a cloud-based service facilitated through ArcGIS Online, the Collector app allows multiple users to simultaneously collect and send data to an online feature service that is capable of storing and displaying spatial, photographic, and tabular (form/attribute) data in one location.
Preparing the dataset for mobile collection was easy and could be completed by one person using ArcGIS for Desktop. Creating a geodatabase with defined domains allows users to populate feature attributes from a coded set of choices. This produces consistency throughout the dataset.
In the Collector app, coded values are selected using a simple drop-down box. For example, when evaluating housing reconstruction at a parcel, field personnel assign a recovery score based on a predefined scale that ranges from 0, which indicates no recovery, to 4, which indicates full recovery.
In addition to setting database domains, using thematic symbology also improves consistency and efficiency in the field. Color-coding the recovery points based on their collection status (an attribute that can be changed in the field) enables field units and project managers (sometimes in another state or country) to easily track the overall progress of data collection. Red points indicate areas to be collected, green points show where data collection is complete, and blue points indicate that the data has been cross-checked for quality control and completeness. Enabling attachments on the feature class allowed photos taken in the field to be stored directly with the associated parcel.
To make the layer available in the Collector app, the symbolized feature class was published as a feature service on the HVRI ArcGIS Online site. From ArcGIS Online, the dataset was combined with other ancillary layers (neighboring parcels, roads, a basemap) and saved as a web map.
When making the map, the GIS technician could customize the editing experience by making only certain layers editable, thus preventing features on other layers from being deleted. Once the map is saved, it can be accessed for editing on a mobile device via the Collector app. Edits made to the feature service in Collector are backed up in the cloud, circumventing the threat of data loss from hardware failure or human error.
HVRI’s initial development of the Collector dataset took just seven days from inception to field deployment. To quickly familiarize the staff with the new technology and ensure proper implementation, the HVRI designed a local pilot dataset and conducted two field training sessions that let staff practice data collection and pose questions. These sessions not only provided an opportunity to train HVRI staff in the use of the Collector app but also created an opportunity to uncover small issues with the feature service and make appropriate edits before deploying a production Collector app in the field.
An Improved Field Experience
Using Collector for mobile data collection significantly improved the efficiency of HVRI field personnel. Instead of carrying multiple pieces of equipment into the field, staff members needed only an iPad with a mobile data connection and GPS capability, which served as an integrated data entry device that also supplied photography and navigation. In rural areas of the study region, where data connections were unreliable, field units used Collector’s disconnected editing to download maps to the iPad and work offline and later synced the map when a connection became available.
The collaborative, cloud-based platform provided in ArcGIS Online created an opportunity for multiple users to simultaneously create, edit, and upload data. Deploying this technology for the collection and analysis of disaster recovery data enabled the team to streamline the long and arduous a process of in-situ data collection, QA/QC, analysis, and reporting.
Using Collector for ArcGIS and ArcGIS Online took a process that initially took 8–10 weeks from initial development to final product and turned it into a process that took much less time and effort—just two weeks from start to finish. Budget savings were realized when data collection time was reduced by 50 percent, effectively shrinking personnel deployment costs. Ancillary benefits identified during beta testing included the ability to track field team progress minute by minute so that teams could be rapidly redirected based on their progress. Real-time data updates effectively increased field team coordination as they traveled across the study area and decreased data collection issues and the need to reroute to capture missing data points.
Finally, the cloud-based data collection and storage available through the Collector app meant data QA/QC and review of data by nondeployed base personnel occurred in near real-time, resulting in finalized and complete, quality-controlled data within one day of initial collection. The integration of field data into a single product significantly reduced the burden of postprocessing. Furthermore, the dataset produced in the field is compatible with ArcGIS for Desktop, enabling simple integration with previously collected datasets.
Using Collector and ArcGIS Online allows HVRI to easily integrate field data in a single product and reduce the amount of equipment needed in the field. It provided a real-time snapshot of progress that enabled coordination of field personnel as well as nondeployed base personnel who could perform real-time QA/QC. It significantly reduced the time and cost associated with field data collection.
The true value of the Collector app was demonstrated in three key ways: time savings; error reduction; and standardization of storage, display, and analysis. The streamlined process of building, deploying, and editing recovery data with the Collector app realized a 50 percent time savings for field personnel and an 80 percent savings in cost and effort for base personnel associated with QA/QC, analysis, and results display. Streamlining the process not only saves time and money during more restrictive budget periods but also facilitates the more rapid infusion of results into products and future research planning.
Acknowledgments
This material is based on work supported by the US Department of Homeland Security under Grant Award Number 2008-ST-061-ND0001-07.
Disclaimer
The views and conclusions contained in this document are those of the authors and do not represent the official policies, either expressed or implied, of the US Department of Homeland Security.
About the authors

Daniel Morath