In his Plenary Session presentation at the 2014 Esri User Conference, Steve Misterek, GIS coordinator for the City of Minneapolis, told how his team’s response to adversity led to an approach that used ArcGIS Online to share GIS resources with city staff and citizens. This approach has made the city into a Smart Community—one that efficiently uses resources and can mitigate and bounce back from disasters both natural and man made.
Smart Communities is an overarching term that encompasses concepts and values from other initiatives including sustainable cities, healthy communities, livable communities, and smart grid. The impetus for each of these is the creation of communities that are productive, responsive to citizens, and able to handle economic and environmental challenges.
An early adopter, the City of Minneapolis has been using GIS for decades. It had many experienced users in various departments across the city but, despite the best efforts of the GIS department, it could not realize its vision for an enterprise implementation of its GIS. The strong focus on standards and centralization led to resistance in some departments and the siloing of information.
Then the recession hit, and the city’s GIS team was cut from eight to three. Misterek realized that to succeed or even just survive, they would have to come up with a different approach. Their new priorities were serving the city’s core business needs, convincing middle management that GIS could really improve the bottom line, and showing the value of GIS to executive leadership. This meant the team had to change its view of what a GIS professional does, use a relaxed approach that trusted users more, and let go of some of the control they previously held.
The focus changed to building enabling infrastructure, sharing the team’s education and expertise with the organization, and promoting their capabilities and agility. Within the city, they had to sell GIS to three separate groups—innovators, traditionalists, and leaders—using three different approaches. They had to teach and support the innovators. For the traditionalists, they needed to show the value of GIS in enhancing existing business workflows. For the leaders, they just had to provide timely answers.
Adopting the Web GIS pattern and embracing ArcGIS Online made it possible for Minneapolis to meet its goals and win over the city’s innovators, traditionalists, and leaders. The team launched MapIT Minneapolis in 2012, the city’s ArcGIS Online site, which makes the existing GIS resources available to hundreds of city employees and citizens. It used many of the State and Local Government Solutions maps and apps to quickly create tools for leveraging Minneapolis’s robust existing GIS.
In their plenary presentation, Misterek and fellow team members Nathan Aamot and Phil Holleran shared some of the success stories about their users. One such user, Philip Potyondy, provided a great example of how MapIT Minneapolis has made the city more resilient.
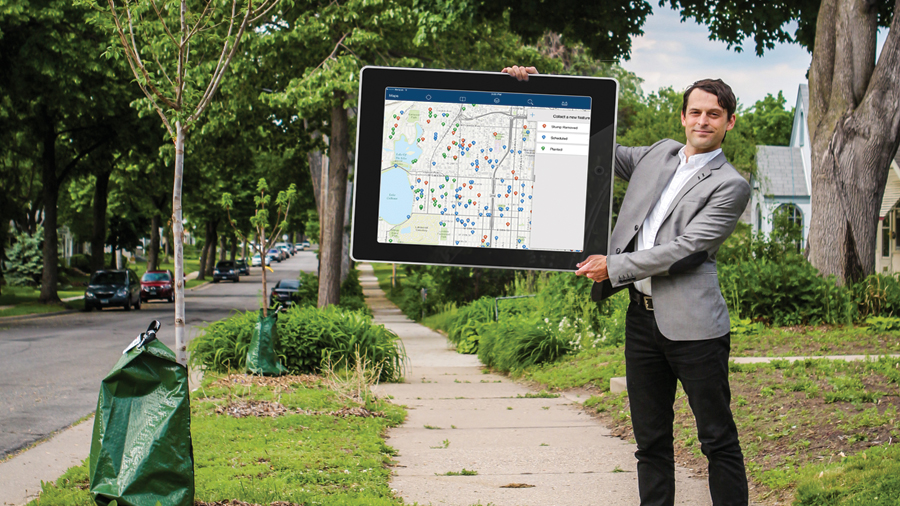
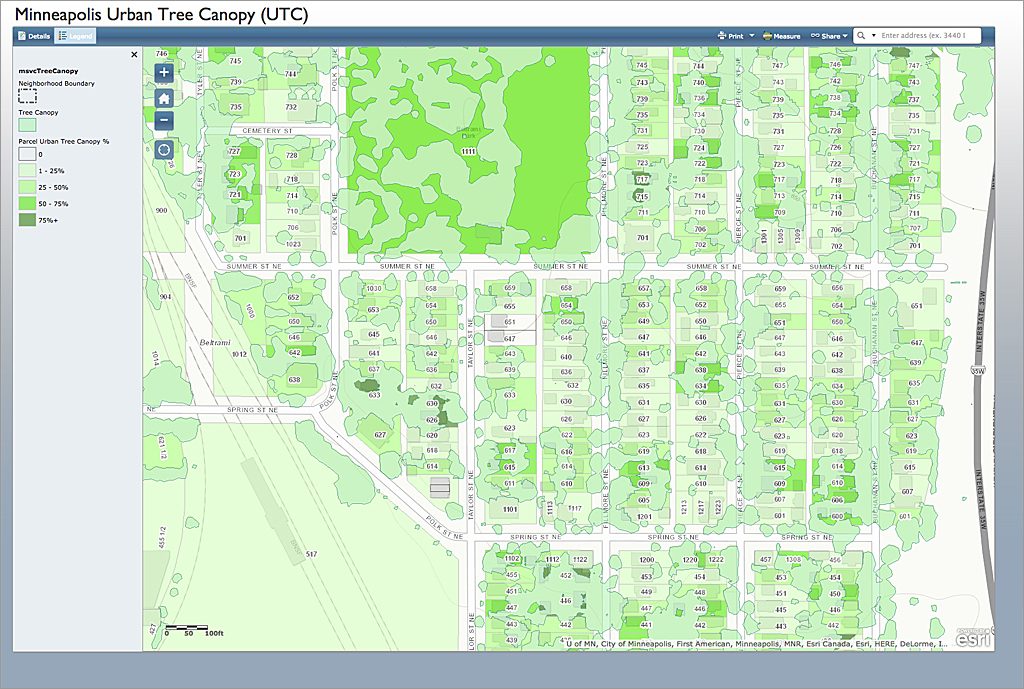
Potyondy, the city’s urban forester, was an early and innovative adopter of MapIT who used GIS to enhance the city’s resiliency and save the city money. A severe storm in June 2013 downed 1,800 of the city’s street trees. Potyondy and other city arborists rapidly inventoried the fallen trees using Collector for ArcGIS on mobile devices. This same data was used not only to manage removal of the tree debris but also schedule the removal of the stumps, apply for Federal Emergency Management Agency (FEMA) reimbursements, and plan the replanting of trees. While he was performing the initial fallen tree inventory, Potyondy recorded any pavement damage near fallen trees and shared that information with the public works department so those repairs could be scheduled and handled expeditiously.
Potyondy’s use of ArcGIS helped the city remove hazardous fallen trees, repair infrastructure, gain recovery funds, and streamline the operations of not one but two departments. By answering the where question for any project, initiative, or policy, MapIT has succeeded in making Minneapolis much more nimble in responding to the city’s needs.
Governments at every level and across the world are struggling with many of the same problems that faced Minneapolis: limited resources, calls for more accountability and transparency, and improved delivery of government services. At the same time, conditions have become more challenging: lingering economic pressures from the Great Recession; extreme weather events brought on by climate change; and the need to make cities safer, healthier, places to live.
Governments are turning to GIS technology to create information from the data they collect, then analyze that data to understand and develop better strategies for solving problems. Initially, GIS adoption was tied to specific projects or existing workflows. With the development of the ArcGIS platform, governments at all levels are discovering that the power of location and spatial thinking can be applied to nearly every area to realize higher levels of service.
As GIS has moved to the ArcGIS platform, it has taken on an increasingly larger role in creating Smarter Communities. The ArcGIS platform supports geospatial capabilities for four groups: GIS professionals, knowledge workers, decision makers, and software developers. State and Local Government Solutions maps and apps, available to ArcGIS Online subscribers, make the information derived from GIS available to knowledge workers and executives in government. Location analytics such as Esri Maps for SAP BusinessObjects and Esri Maps for IBM Cognos geoenable business intelligence systems by placing all kinds of tabular and enterprise data into a geographic context. Operations Dashboard for ArcGIS uses a geographic framework for monitoring processes throughout the organization.
Data currency is always a challenge. ArcGIS Online supplies constantly updated basemaps, current imagery, and thousands of data layers contributed by the ArcGIS Online community. Instead of having to search for the most recent data, import, and then process it, data is managed by Esri.
Operational data, such as the locations of fallen trees in the MapIT example, can be immediately integrated with these layers using mobile devices, such as smartphones, with Collector for ArcGIS. This streamlines data collection, whether the data describes houses damaged in a fire or fire hydrants inventoried to track their condition.
GIS excels in enhancing intragovernment communication and collaboration. In the recent Capstone-14 disaster response exercise, ArcGIS Online provided a common operating picture for emergency response teams from eight states in the US Midwest. (See “The Key to Disaster Response: ArcGIS has pivotal role in massive exercise” in this issue.) In public policy development, GIS is helping the US Forest Service develop the national forest plan by giving people inside and outside government the tools and data to ask better questions, explore opinions, and make better decisions, according to Kent Connoughton of the US Forest Service, whose interview, “GIS as a Tool for Building Policy,” appears in this issue.
Perhaps even more critical for governments dealing with the effects of climate change is the ability to run prediction models that reveal the effects of trends and help develop long-range plans that mitigate the effects of disasters such as floods on the local populations, infrastructure, and economy. An article in this issue, “Designing for Climate Change with GIS” describes a comprehensive climate change vulnerability assessment conducted by the Massachusetts Army National Guard at Camp Edwards using GIS.
GIS is tremendously useful in distributing resources. Nadika Senadheera, who works for the United Nations World Food Programme, uses GIS to locate vulnerable populations in South Sudan and determine safe and efficient routes for airlifting relief supplies to them. She tells how she does this in “Aid from Above” in this issue.
The tools for enhancing collaboration, communication, and analysis in ArcGIS are based on decades of working with and listening to the needs of users. As part of this ongoing process, Esri began creating a host of apps that support Smart Communities. The goal is to make these State and Local Government Solutions, widely available and accessible to jurisdictions, no matter their size or resources.
The specific apps chosen for development came out of a series of whiteboarding exercises that were held jointly by Esri and the International City/County Management Association (ICMA). Officials from cities and counties—large and small—were asked which apps would make their city or county more resilient. The proposed apps were prioritized and built based on best practices and the experience acquired through years of working one-on-one with users across disciplines and governments.
State and Local Government Solutions help cities, counties, states, and even nations become Smart Communities. The more than 150 solutions can be implemented immediately; configured to enhance use, and, if desired, extended using solutions from Esri partners that are built on these solutions or in-house development resources. These apps help leverage organizational resources, incorporate community knowledge, and enable innovative approaches to the challenges governments face so that communities will be better places to live and work.