The power of 3D data extends beyond just delivering contextual visualization and spatial understanding. The 3D perspective, combined with GIS, enables users to understand and interpret high volumes of complex location data with greater accuracy and speed.
Advances in 3D data capture and creation, such as reality capture and feature extraction from point clouds, have led to the generation of extensive and distributed 3D datasets. Detailed meshes and citywide scale 3D objects are an integral part of 3D GIS workflows. In response, Open Geospatial Consortium (OGC) 3D data standards, such as Indexed 3D Scene Layer (I3S), and 3D Tiles, were designed to stream massive 3D content files on mobile and web applications.
With many Esri customers working with a variety of open 3D data standards, supporting 3D Tiles ensures critical interoperability within ArcGIS. ArcGIS enables organizations across diverse sectors to implement a multidimensional system of record by combining geospatial imagery, reality mapping, real-time data, and realistic 3D environments. Organizations in national, state, and local government; the architecture, engineering, and construction (AEC) sectors; and other industries are leveraging the tools in ArcGIS Pro to implement 3D workflows for everything from asset monitoring and mission planning to performing risk analysis.
With the latest release of ArcGIS Pro, users can consume the integrated mesh and 3D object elements of a 3D Tiles tileset from local directories or public services. Future integration of 3D Tiles in ArcGIS will include the ability to publish to ArcGIS Online and ArcGIS Enterprise as a tile-hosted service with added support throughout ArcGIS Platform for developers.
3D Tiles layers can be combined with other layers for use in exploratory analysis tools, animations, and layouts to reveal additional context and improve decision-making. This article explores how users can incorporate 3D Tiles into workflows, just like any other 3D layer in ArcGIS.

Working with 3D Exploratory Analysis Tools
Three-dimensional exploratory analysis workflows in ArcGIS Pro allow users to investigate their data interactively. Tools such as viewshed and view dome give users the ability to perform visibility analysis while also empowering them to make changes to parameters in real time. Not limited to visibility analysis, exploratory analysis workflows also allow users to dynamically peek inside or slice through terrain and 3D objects. For example, users can explore the spatial relationships between surface and subsurface infrastructure dynamically.
Interactive Viewshed
A viewshed analysis is a type of visibility analysis that calculates and displays the visibility of 3D elements in a scene from an observation perspective. It is calculated from an observer point, which can be a point location, a camera location, or a geoelement. (A geoelement is any element in a map or map view that can be identified by its location to return attribute information. Geoelements can be features from a feature layer, graphics in a graphics overlay, or cells from a raster dataset.)
Viewshed analysis produces a viewshed layer that indicates what can be seen and what cannot be seen from the observer’s location. This analysis is commonly used by telecommunication companies. When planning the placement of cell towers, these companies use viewshed analysis to optimize service coverage by identifying locations that have a minimal number of obstructions from natural elements (e.g., mountains or trees) and human-made elements (e.g., buildings) that can disrupt radio signals.

Interactive View Dome
Interactive view domes are used to determine the visible volumetric spaces in a direct 3D distance of a location. They are calculated against the currently displayed content in a scene, including the ground surface and symbolized features such as buildings and trees. They display which parts of the environment can and cannot be seen from the location of a specified point.
View domes are valuable tools for evaluating sky occlusion in urban areas. Sky occlusion refers to the view of the sky being obscured by an object such as a building. Used in urban planning, development, or construction applications for assessing future impacts of proposed buildings, view domes can assess the impact of proposed new building heights on the sky view factor (SVF).
SVF is a measure of how much sky is visible from a specific point. On an infinite plane, the full half dome of sky would be visible, and that location would have an SVF of 100 percent. Trees, buildings, or hills obscure the sky, which results in a lower SVF. Research has shown that trees and vegetation in urban areas that provide shade can help reduce heat. SVF is a tool for assessing the level of sky occlusion needed to optimize park design to mitigate climate change.
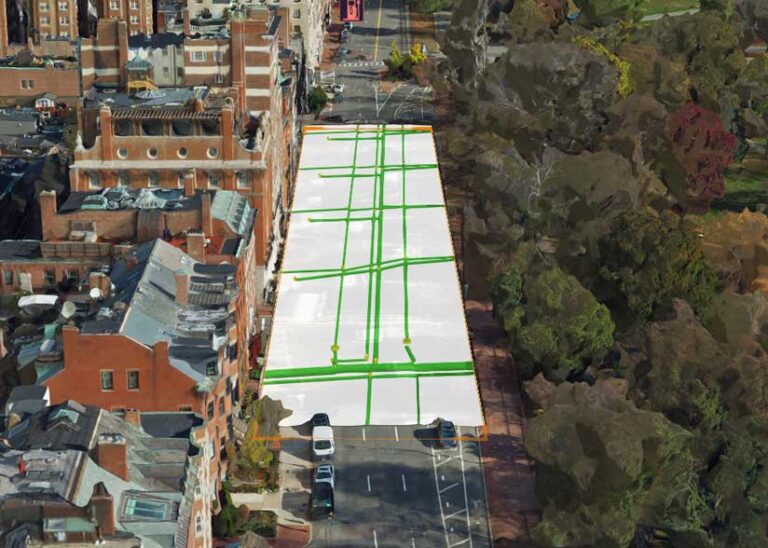
Interactive Slice
Interactive slice is a tool that hides parts of a 3D scene to reveal content that would otherwise be hidden. This tool can be used on any element in a 3D scene to explore the inside of buildings, stacked volumes, or subsurface geology.
Utility companies efficiently track and monitor underground stormwater pipes using this powerful tool. By clipping away layers of roads and sidewalks, the intricate network of pipes is visible, which facilitates the development and implementation of effective maintenance and management strategies. Similarly, AEC firms derive significant benefits from the slice exploratory analysis feature, particularly when visualizing electrical wiring within a building. The process of slicing away obstructing elements, such as roofs, walls, or floors, provides valuable insights into the complex infrastructure and enables decisions to be made with greater precision.
The slice exploratory analysis tool is especially useful for digital twins of cities, buildings, and industrial facilities that have complex 3D layers as built data and include below- and above-ground elements.
Learn about Related Topics
About the author