Visualizing large spatial datasets on the web has always been a challenge. Over the last couple of years, Esri has made substantial improvements in its software that allow you to visualize and interact with larger amounts of data efficiently in the browser.
A web map containing more than 550,000 polyline features that represent water distribution pipes in Bangkok, Thailand, will illustrate the effects of these enhancements on performance when using modern web technology available in the ArcGIS API for JavaScript, ArcGIS Online, and ArcGIS Enterprise to render all this data in a single view.
More Data Is More Challenging
Effectively rendering large datasets in web apps, such as the water distribution pipes in the example, presents several interrelated challenges. Large payloads in query responses (lots of data) mean more storage space and more data needs that are delivered for each query.
Larger payloads lead to longer wait times from server queries. When the client requests a heavier load from the server, you should generally expect it to take a little longer to be delivered to the client.
Larger payloads also lead to longer drawing times. When the browser downloads a large amount of data, the drawing engine used to render the data has more vertices to draw. It will take more time to draw the lines. The effects of these challenges can snowball, creating a slow app and a bad user experience.
Minimize Payload Size for Faster Apps
If the size of the dataset is the root of the problem, then the solution lies in decreasing the size of each query’s payload. Use the following methods to minimize the size of the dataset. A query of a 6.5 MB dataset with 10,000 lines with time to fetch of ~11 seconds is used as a baseline for measuring performance improvement as each method is applied.
Compression
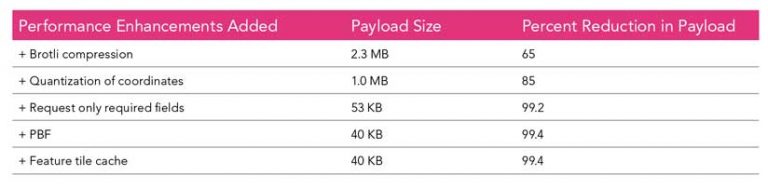
Queries to ArcGIS Online hosted feature services (not ArcGIS Enterprise services) are compressed using Brotli compression [a generic-purpose, lossless compression algorithm] that significantly reduces payload size. The query response payload for the 10,000 lines previously mentioned, including all geometries and attributes, decreases by 65 percent when compression is used.
Quantization
Highly detailed geometries can substantially increase payload size. Higher precision geometries (i.e., more vertices and/or more floating-point precision in the coordinates) require heavier lifting by the server.
Quantization is the process of thinning vertices based on a given tolerance in map units. Typically, the tolerance equals the resolution of the view (i.e., the length of one screen pixel in map units). This ensures coincident vertices that fall within the same pixel will be reduced to one vertex. If the size of an entire feature at a small scale (i.e., zoomed out) is smaller than the size of one pixel, then that feature will be dropped and won’t render. Feature tile queries execute with a quantization tolerance equal to the resolution of the current scale, ensuring the layer is drawn in the most efficient way for the given view scale.
When the data is served by ArcGIS Online and ArcGIS Enterprise as hosted services or from your own database with ArcGIS Enterprise, even datasets that span large extents can be as precise as you want, thanks to quantization. After the client queries geometries from the database, the coordinates are quantized to reduce payload size.
Quantized coordinates for a polyline path are delivered in screen coordinates so that the first vertex represents the position relative to the tile origin. Each subsequent coordinate in the path represents the position relative to the previous coordinate (e.g., [345, 894], [+1, 0], [-1, -1], [0, 1]). This format is much smaller than raw coordinates and compresses well, which reduces the payload for each query, thus increasing the speed of the application.
For the baseline uncompressed payload size of 6.5 MB for 10,000 features, quantization, when added to Brotli compression, reduces the payload size by 85 percent.
Remove Unnecessary Attributes
Requesting data attributes that aren’t required for rendering is one of the most common causes of unnecessarily large payload sizes. Often only one field is required for rendering. The polyline layer in the example contains 32 fields. By restricting the query to the one field needed for rendering, payload size is decreased from 6.5 MB to 52.6 KB. In conjunction with Brotli compression and quantization, limiting the request to one attribute reduces the payload size by 99.2 percent.
By default, the ArcGIS API for JavaScript requests only the attributes required for rendering. If other attributes are required, the appropriate requests are made to include those attributes. For highly interactive apps, it may be more beneficial to request all fields intended for use in the app up front so the user can explore the data without waiting for additional requests.
PBF
The ArcGIS API for JavaScript also requests data in protocol binary format (PBF) by default. Vertex encoding improves when data is requested in PBF, which leads to faster drawing times because less triangulation on the GPU is required. PBF reduces the payload size for the baseline query of 10,000 features by an additional 12 KB to 40.8 KB. The application of Brotli compression and quantization combined with limiting the request to one attribute and requesting data in PBF format reduces the payload size by 99.4 percent.
Caching: Reducing Client and Server Load
Even after implementing all these methods, the first query for the data may still take several seconds before a response comes back. The actual download time is pretty fast, so most of the time is spent waiting on a response from the server. That’s because a lot of data needs to be queried directly from a database.
When you publish a large dataset to the ArcGIS Online cloud as a hosted feature service, you immediately benefit from a system involving tile queries and several tiers of response caching that speeds up performance and reduces load on the client and server that occurs after the first query. Executing the same query for 10,000 features a second time shaves the response time down dramatically to between 100 and 200 milliseconds. Table 1 summarizes the cumulative reduction in payload size as each of the methods discussed is applied.
Feature Tile Caching
To avoid a few large requests, features are requested in tiles. This splits the query up into several smaller spatial queries. Tile requests have the benefit of being consistent across different users and apps. This consistency allows query responses to be cached in your browser and once on the server so they are shared among all users. This frees up the resources on both the server and the underlying database, allowing feature layers to scale to millions of users and clients without the need to explicitly generate tiles ahead of time. (However, ArcGIS Online does support generating tiles when needed.)
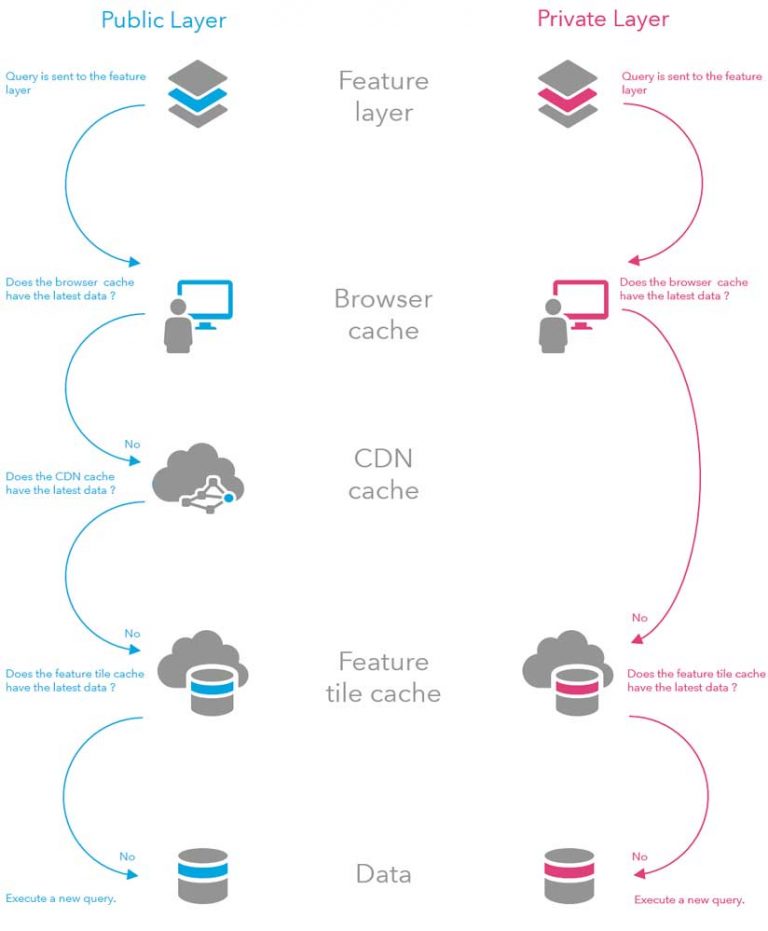
Feature tiles are cached in tiers, shown by the diagram on page 33. A feature tile cache can be persisted on the browser, server, or content delivery network (CDN). If a cache is requested using a client request, the underlying database doesn’t need to be queried.
Cached responses from the server are automatically invalidated as the data is edited. This ensures that clients using the layer always get the latest information.
CDN Caching
CDNs are the backbone of a speedy internet. A CDN is composed of many servers within a network that copy or mirror content and deliver it to clients based on geographic location. For example, content published to the CDN from Japan can be quickly downloaded in Brazil if a CDN server on the same network is located in Brazil.
For publicly shared, hosted feature services, CDN caches query responses so everyone (not just you) using the same layer benefits from a smaller payload. The CDN is distributed all over the world and mirrors the cache. That means even if the servers hosting the data are located halfway around the world, the cache is most likely much closer to you, making it faster to download.
This is extremely powerful. While it may have taken my original query about 10 seconds to complete, anyone else executing the same query from the same service will get a cached response based on my original query in just a few milliseconds.
Server-Side Caching: Shared and Stored in ArcGIS Online
To protect the privacy of nonpublic services, layers shared only with users in your organization do not make use of the CDN response cache.
However, the internal infrastructure of ArcGIS Online also provides server-side caching so that other users in your organization can reuse the cache when the browser cache and the CDN can’t be used. As a result, queries come back quickly, put less load on the underlying databases, and keep everything running smoothly at scale even under heavy load. (Future versions of ArcGIS Enterprise will have similar server-side capabilities available.)
Cache Control
You can further improve the performance of data loading by increasing the length of time the current cache is considered valid. The maximum amount of time you can set is one hour before updates are seen. This comes at the cost of users not immediately seeing updates to the data until the refresh interval kicks in.
Optimize for Scale
ArcGIS Online offers the option to selectively optimize different layers that contain complex polylines and polygons. This saves several versions of each feature’s geometries at various levels of resolution, so the initial query for those features is faster. This benefit is most clearly seen in the initial query. Because of the caching described above, you may not see much of a performance difference after you load the data for the first time.
Since the example polyline dataset contains many vertices that will be viewed at small-to-medium scale, choosing this option will increase performance at those scales and maintain performance at larger scales but will come at the cost of increased storage space on the server.
You can optimize layers for drawing by checking the Optimize layer drawing option on the settings tab of the layer’s item details page of ArcGIS Online.
Conclusion
You can visualize a lot of features on the web in a performant, interactive way. Although the ArcGIS API for JavaScript, ArcGIS Online, and ArcGIS Enterprise don’t specify specific limits on the number of features you can display and analyze at one time, there are limitations. See the accompanying article “Visualization Best Practices” for some tips to improve the effectiveness of your web map while maintaining responsiveness.
Ultimately, the data size and feature limit for layers depends on factors including network bandwidth, your hardware (e.g., mobile devices won’t allow you to download as many features as a desktop browser), and how much the browser can handle.
This article highlighted some of the ways the ArcGIS Online, ArcGIS Enterprise, and the web API teams at Esri improved performance over the last few releases. These teams are continually working to improve these products for future releases.
Paul Barker contributed to this article.
About the author