Building an effective GIS strategy involves identifying meaningful opportunities, determining their value, and setting priorities.
Strategic planning can be tough. Despite all the different tools and guidance available, devising a strategy that is both visionary and practical can seem intimidating. For most, the work required and the fear of failure outweigh the potential benefits. It’s no wonder that when it comes to building a GIS strategy (or a location strategy), a lot of managers avoid the exercise altogether.
For some, the problem relates to uncovering meaningful opportunities to use GIS inside their business. For others, it’s about showing clearly where and how these opportunities are delivering business value. Still others struggle with prioritizing opportunities and figuring out where to start.
The reality is that an effective GIS strategy addresses each of these requirements, and you have to do a bit of work on all of them. The good news is that getting there is easier than it sounds. With a bit of focus and some flexible tools, we can draw a straight line between opportunities, business value, and priorities. Let’s look at three steps for incorporating GIS and location into your business and how to get to the heart of what matters.
Step 1
Uncovering Opportunities
Simply identifying the ways in which GIS can be used is often one of the more challenging steps in building a strategy. With so many options available in the world of geospatial technology, it can be overwhelming to narrow down the potential solutions. At the same time, understanding the numerous functions that a business performs and then recognizing authentic business needs at an enterprise level can be a Herculean task.
Often it’s about finding the right “altitude” at which to conduct strategic planning. If we work at the business strategy level, we can be stuck defining GIS solutions that are too abstract to be practical. If we drill down to the business process level, we risk identifying solutions for areas of business that are constantly changing or don’t address challenges that cut across the organization.
What we need is a structured way of matching the core capabilities of an enterprise GIS platform with the core capabilities of the business. Fortunately, there’s an effective way to do this. The process involves mapping the core GIS patterns of use to an organization’s business capability model.
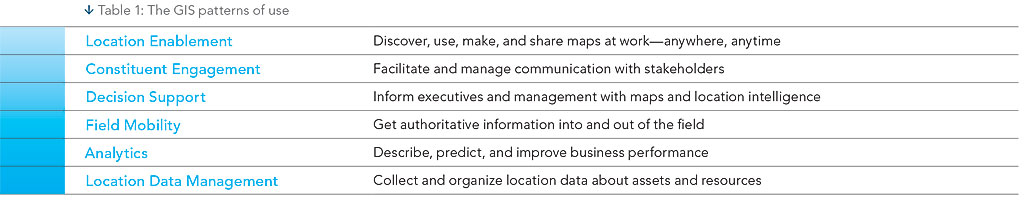
The core GIS patterns of use represent the common geospatial functions that recur across organizations and are supported by most GIS platforms. Consider these patterns the essential capabilities of modern GIS that are enabled by a vast ecosystem of geospatial technologies.
Business capabilities are the key abilities of an organization. They are an articulation of what an organization must achieve to fulfill its mission as opposed to how it achieves it. In practice, capabilities are composed of people, processes, technology, and governance. Because business capabilities are connected to business outcomes, they can be measured for performance. This is key to mapping GIS solutions to the organizational need.
As an example, let’s look at the business capability model for a property and casualty insurance company. Insurance companies insure property owners against liabilities and risks related to ownership of property. The model breaks down the capabilities of the business into three core areas: core value creating, operational, and shared capabilities. Each capability can be broken down further into subcapabilities. For this example, let’s pick customer service and look at an important facet of customer service in the insurance industry: claims management.
In general, claims management involves intake, investigation, negotiation, and settlement of insurance claims. From the filing of a claim to its final payout, insurance companies spend considerable effort managing and improving how the claim is handled to ensure a high level of customer service.
Identifying where and how GIS can be used to support this function is a process of mapping the GIS patterns of use to claims management business capabilities.
Table 2 shows how patterns are mapped to business capabilities. Look at all these opportunities—and these are only some of the possibilities. Let’s look at each capability area in turn.
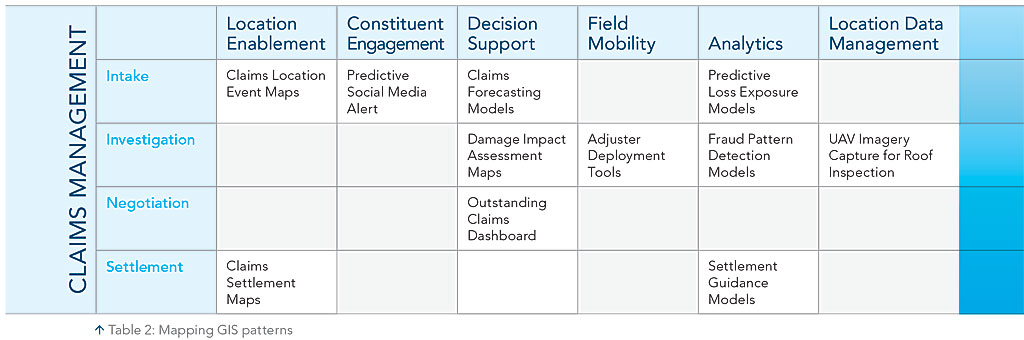
Claims intake is the ability to manage the notification, assignment, and actions relating to an incoming insurance claim. GIS is ideally suited to support this area. Maps of claims locations categorized by the event type allow the business to manage and expedite claims as an overall event situation. Predictive parsing of social media posts lets the business anticipate the location and impact of insurance events. Claims forecasting models anticipate claims by event and location. Predictive loss exposure models estimate losses based on the known loss exposure for a given area.
Claims investigation determines the conditions and context associated with a claim. This is typically analytical and human-intensive work. GIS as a platform for location-based analysis and mobility presents numerous opportunities for investigation support. Damage impact assessment maps show the extent and degree of damage. Adjuster deployment tools automate the submission of claims information to adjusters in the field and expedite the investigation process. Fraud pattern detection models predict fraudulent claims based on location patterns. Unmanned aerial vehicles (also known as UAVs or drones) can quickly and accurately capture aerial photos and video of damage to building rooftops.
In the claims negotiation process, the parties arrive at an outcome that satisfies insurance terms and the interests of the policyholder and policy provider. The negotiation process can be a long, drawn out affair. GIS can play a role in monitoring and resolving issues related to claims negotiations through the use of outstanding claims dashboards. Managers can monitor where in the process claims are hung up and if there are observable trends based on location or event type.
During the claims settlement process, the claim is settled, paid, and closed to the satisfaction of the policyholder. Settlement is the final phase in handling a claim and the end of the customer service experience associated with a specific claim. GIS supports consistent handling of claims settlements with claims settlement maps that provide details by area and event to ensure consistent handling of similar events. Settlement guidance models are prescriptive and can guide an agent through processing a claim and suggest a settlement for a known event based on defined criteria.
These are just a few of the opportunities for applying GIS that are available. Capability mapping can be applied to any business area and any organization regardless of industry. The key is identifying the business capabilities of relevance to your GIS strategy and diligently mapping them to the patterns of use.
When uncovering opportunities, remember to
- Work at the capability level—both in terms of business and GIS.
- Diligently identify your organization’s business capabilities: focus broadly, not deeply.
- Analyze the patterns of use to identify where and how GIS can enable your business capabilities.
Step 2
Linking to Business Value
At this point, we’ve unearthed a handful of interesting opportunities where GIS could be used to support key business areas. But it begs the question: How do we assign specific business value to these GIS solutions? And how do we demonstrate the value to stakeholders?
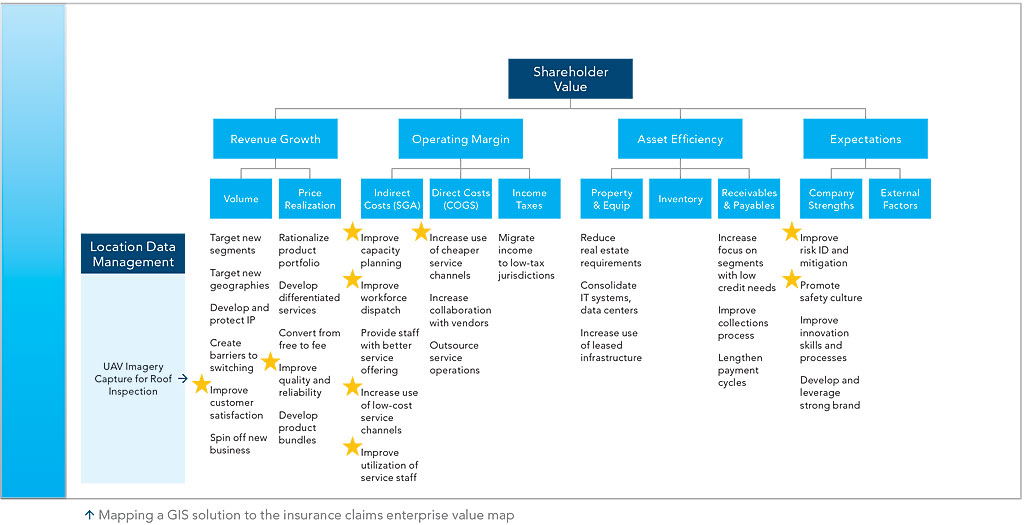
An enterprise value map is a powerful tool for understanding how value is created within a business (i.e., the value drivers). It also identifies the value levers that are the specific actions an organization can take to create value. The generic version of the map assumes that value to shareholders is created through a combination of strong revenue growth, a healthy operating margin, efficient use of corporate assets, and the ability of the management team to sustain the value. The challenge is to identify activities or solutions that drive value by pulling on the value levers.
The benefit of the enterprise value map is that it pinpoints the kind of value that actions and solutions create. This helps with prioritization. For example, a director might say, “Based on our organization’s strategy, we favor actions that grow revenue over those that improve asset efficiency.” The enterprise value map makes this clear and explicit.
The accompanying diagram shows an abbreviated enterprise value map that lists a selection of value levers that we can apply to the insurance company example as they relate to the UAV rooftop inspection solution. There is a lot of intuitive value in a solution like this, but once we link all the ways the solution drives value on the enterprise value map, we can see that it might have even more potential than first thought.
We can see where and how the UAV solution creates value. A remote inspection solution would enable the business to process claims faster with greater consistency. This would improve customer satisfaction and the quality and reliability of services—all levers associated with revenue growth. The UAV solution could also significantly reduce the time required to conduct an investigation, which would improve staff capacity planning and utilization and lower costs—levers that improve operating margins.
Using UAVs keeps investigators off rooftops. This could dramatically improve safety and lower the risk associated with this type of work. It would also enhance the perception of the business in the eyes of external stakeholders as a sustainable enterprise—levers associated with shareholder expectations.
The benefit of the enterprise value map approach is in the process. Initially, a solution like the UAV solution might be thought of as a time-saving opportunity. But by mapping this solution to value levers, we see many other benefits. These additional benefits could elevate the UAV solution from a tactical opportunity to a move that supports the organization’s most important strategic objectives.
Another interesting feature of an enterprise value map is its ability to demonstrate why a solution fails to create any significant value. In the case of the UAV solution, not much is being improved in terms of asset efficiency. If asset efficiency is a strategic priority for the business, this can be the catalyst for further exploration into solutions that do impact asset efficiency. In this way, the enterprise value map is very much an iterative tool. Not only does it show the link between a solution and the value created, but when it is applied in reverse, it can also aid in identifying gaps in value creation—identifying areas where opportunity discovery should be focused.
Although the enterprise value map can be applied to any industry, it is particularly suited to the private sector. For public sector organizations that measure value in terms of social outcomes and public values, a value map that incorporates societal themes would provide a broader and better picture.
Remember…
- Use the enterprise value map to link GIS solutions to the source of value.
- Work iteratively, move from solution to value and vice versa to address gaps in value creation.
- For public sector organizations, supplement the enterprise value map with social drivers.
Step 3
Setting Priorities
So far, we’ve uncovered a bunch of great GIS opportunities and showed where and how they create business value. It’s an impressive list! But we haven’t determined if the return on investment makes these opportunities viable. Most organizations have limited resources and can’t take on every opportunity. We need a way to set some priorities.
Key to setting priorities is evaluating the cost and risk of an opportunity against its value. The process involves determining the risk and value factors most important to the organization and developing a method of scoring each opportunity across the range of factors. These factors can be operational, tactical, or strategic. Opportunities that provide a positive balance of cost versus risk versus value are good investments and should be prioritized for implementation.
For cost, we want to assess the total financial cost of implementation and ongoing operational costs. This includes software, hardware, and human resourcing (project and operational). Ongoing costs must not be ignored. Too often, we see organizations do a good job of summing up the initial implementation costs but a poor job of considering the cost of sustainment.
On the risk side, we need to look at a composite of factors—these include capacity and complexity. For capacity, we want to evaluate the organization’s ability related to delivery and support of the solution. If ability is low, it may indicate the need for capability building. For complexity, we need to assess the technical complexity involved with implementation of the solution as well as the organizational complexity involved in integrating the solution into the business. Other factors can be included in risk analysis, but these form the baseline.
On the value side, we previously showed where and how value is created using the enterprise value map but not its relative importance. To do that, we need to identify the composite of value factors. Typical factors include strategic alignment, financial benefit, and competitive advantage. When combined, these factors demonstrate the relative value of an investment from an operational, tactical, and strategic perspective.
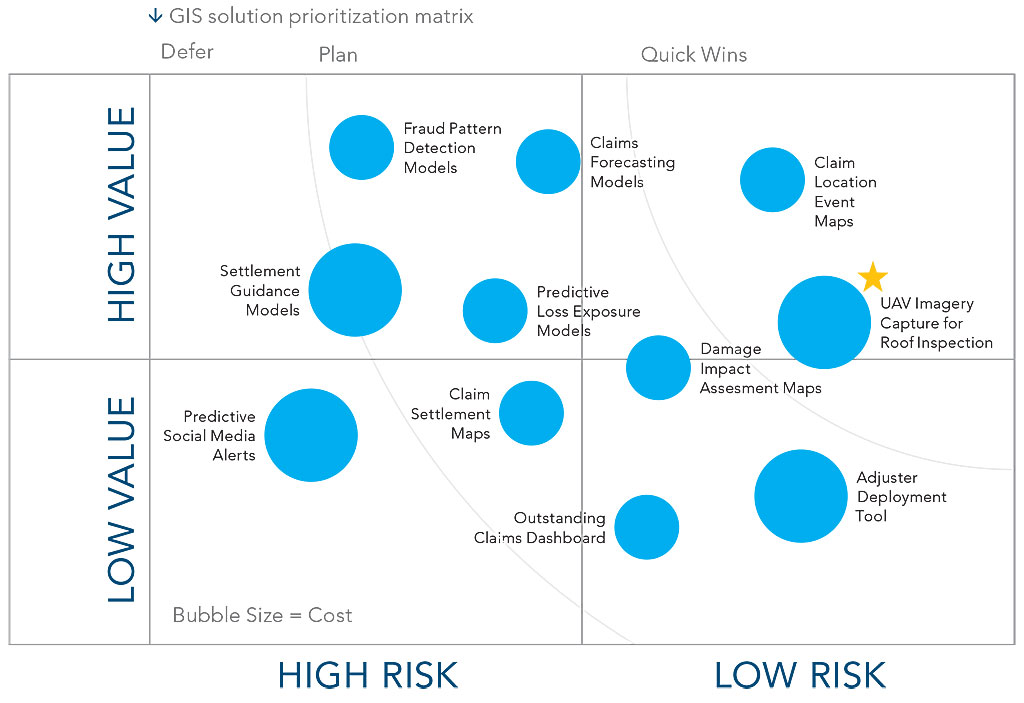
To use the insurance company example, we can create a chart that shows cost-risk-value prioritization. The solutions are distributed across the chart, but based on some judgement calls, we can group them into three loose clusters.
The high value-low risk opportunities could be called the Quick Wins cluster. The UAV rooftop inspection solution falls into this category, as the range of value it delivers, relative strategic importance, moderate cost, and moderate risk make it a worthwhile investment. The high value-high risk and low value-low risk groups can be called the Plan cluster. These are opportunities that need further exploration or capacity building to implement. The final cluster is the Defer cluster. These are the low value-high risk opportunities. These solutions should be reevaluated or avoided altogether.
The main point of prioritization is to have a structured and justifiable way of deciding which opportunities you should tackle. Once prioritized, the implementation road map is quite straightforward.
Remember…
- Prioritize opportunities based on cost, risk, and value.
- Use a composite of factors when developing risk and value criteria.
- Be methodical and be honest when you prioritize!
Strategy, by definition, involves a degree of uncertainty. Focusing on discovering meaningful opportunities, linking them to value, and setting priorities can help to ease doubts and strengthen your GIS strategy. With a little bit of work, you’ll get a better strategy that you can communicate up and down your organization.
This article was originally published in the Esri Canada Blog (resources.esri.ca/management-consulting).