On June 7, 2016, at 8:03 a.m., a 9.0 magnitude earthquake, centered 70 miles off the Oregon coast, violently shook the Pacific Northwest from Northern California to southern Canada for about five minutes. Because the earthquake’s epicenter occurred deep in the crustal plates beneath the Pacific Ocean, tsunami waves as high as 40 feet formed and struck the coast about 20 minutes after the initial earthquake jolt. The other side of this wall of water surged west, taking 10 hours to reach the Japanese coast 5,000 miles away.
Fortunately, this is not the description of an actual disaster but the scenario for an emergency response exercise called Cascadia Rising. It was organized by the Federal Emergency Management Agency (FEMA) to test the readiness of emergency responders in the Pacific Northwest region for a major earthquake similar in size to the one that struck Japan in 2011. The multiagency exercise was staged June 7–10, 2016, and included more than 165 organizations in Oregon, Washington, California, Idaho, and Canada.
The City of Salem, Oregon, which participated in the exercise, activated its Emergency Operations Center (EOC) and mobilized its EOC GIS team. It used ArcGIS as a geocommunication platform for collaboration, resource allocation, and damage assessment.
“The exercise was about simulating the first week after a catastrophic 9.0+ earthquake and resulting tsunami striking the area,” said Susan Blohm, GIS manager for the City of Salem, Oregon. “It was a multistate event that required the activation of EOCs throughout the Pacific Northwest region.”
Overdue for a Major Event
The Cascadia subduction fault zone stretches approximately 800 miles along the western coast of North America from Cape Mendocino in northern California to Vancouver Island in British Columbia, Canada. The offshore Juan de Fuca plate is being shoved under the North American plate. The subduction zone is named for the Cascade Mountain range, which includes active volcanos. It is part of the Pacific Ocean’s Ring of Fire, where the majority of the world’s largest earthquakes occur.
Chris Goldfinger, a professor at Oregon State University (OSU) and an expert on subduction zone earthquakes, indicates that the last major earthquake occurred on the Cascadia subduction zone on January 26, 1700. An extensive study authored by Goldfinger and other OSU researchers concluded that there is a 40 percent chance of a major earthquake occurring in the southern margin of the Cascadia fault zone during the next 50 years that will be similar in intensity to the 2011 Japanese event. The research also indicates that earthquakes in this region occur every 240 years on average, making the next one already about 75 years overdue.
Testing Real-Time Collaboration
“All of us in this region that are involved in emergency operations are well aware of the potential devastation from a 9.0 earthquake and the fact that it could strike at any time,” said Blohm. “Our fundamental goal for the exercise was to participate in a meaningful, collaborative way. We accomplished this by creating the Situational Awareness Framework for Events Portal, successfully implementing Portal for ArcGIS with 100 temporary ArcGIS Online user licenses that we distributed throughout our local area.”
“Because of the low learning curve of ArcGIS Online, training wasn’t necessary, and we were very satisfied with the results,” said Blohm. “We were able to quickly stand up a working prototype of an expanded local emergency services network for data management, visualization, and resource sharing. In addition, we supported the overarching objectives for the exercise established by the Oregon Office of Emergency Management (OEM) that included operational communications, public health and medical services, mass care services, situational assessment, critical transportation, and operational coordination.”
According to Dan Brown, the city’s GIS technical lead, SAFE Portal was not only the technology platform but also the geocommunication platform for collaborating in real time. “I am looking forward to using SAFE Portal to further strengthen our city, county, transit, schools, health, and business community to use the power of Web GIS and to go beyond the limited use of paper maps.”
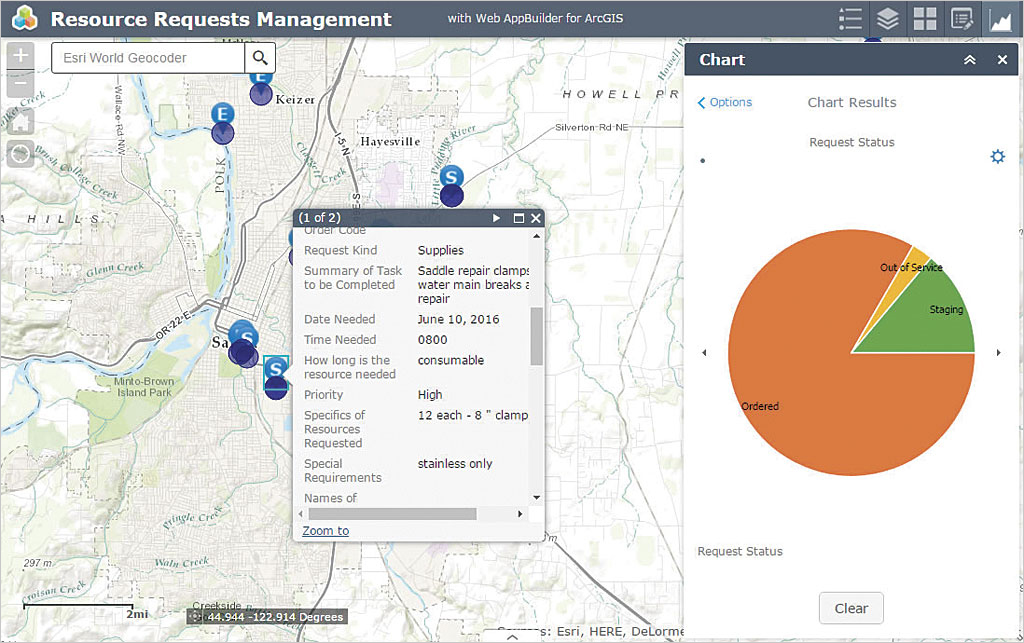
Salem allocated its ArcGIS Online licenses to facilities in the city as well as cities within Marion County where it is located. This distribution of software licenses to other jurisdictions—the Red Cross, Citizen Emergency Response Teams (CERT), the local hospital, and others—allowed those organizations to interactively share information directly related to Oregon OEM’s objectives with the Salem EOC in real time.
Emergency 911 calls, as well as other critical resource requests, were reviewed to determine the appropriate response based on needs, resources, and locations. In addition, they could share and exchange resources with one another. The locations of all mass evacuation and response shelters, such as hospitals, were available through the portal. Field teams recorded damage assessments with Collector for ArcGIS and attached related photos to their reports. Transportation networks were assessed and GIS used to identify alternative routes for transporting critical goods and providing services to the most vulnerable populations.
By coordinating operations through Portal for ArcGIS, information was shared in real time between participants, local EOCs, the state, and federal organizations such as FEMA.
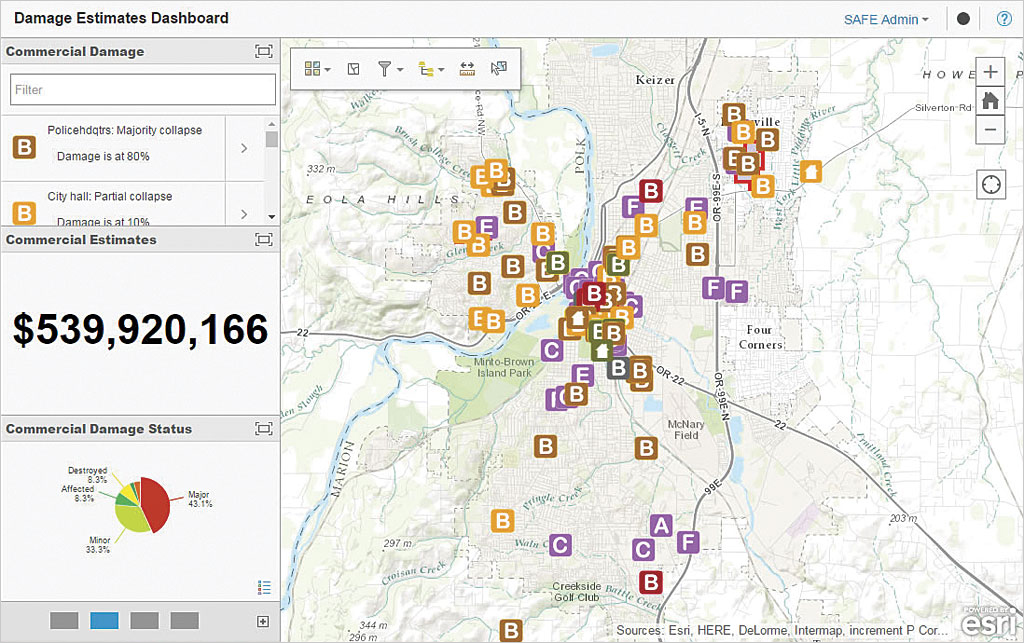
“We developed an effective application for damage assessment for the exercise,” said Blohm. Each damaged property’s value was obtained from the county assessor’s records. Teams in the field estimated the percentage of a property that sustained damage. This percentage was applied to the assessed value to estimate the cost of damages. For example, the loss for a house valued at $300,00 that was 50 percent damaged was estimated to be $150,000.
“We kept a running total of property damage displayed on the EOC dashboard so that it could be readily reported to FEMA, because when you reach a certain financial threshold, you can request federal emergency disaster relief assistance including financial relief funding,” said Blohm.
Bringing All the Data Together
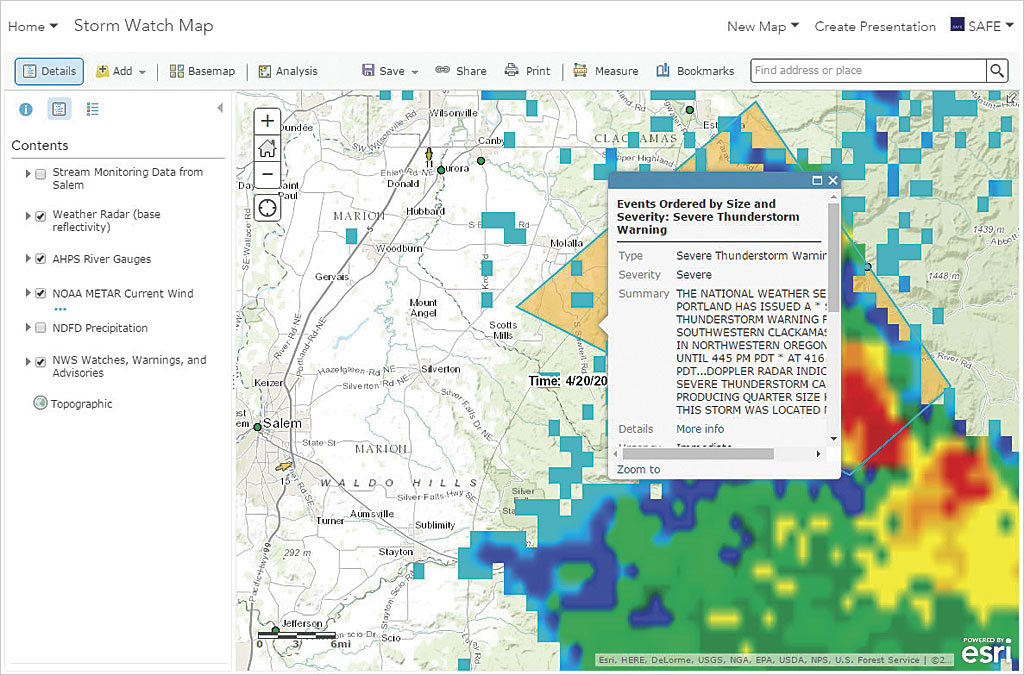
Online content was an important part of developing the big picture at the EOC. The city not only displayed the information it was collecting in the field but also looked at seismic activity from the US Geological Survey, weather patterns from the National Weather Service, and local citizen vulnerability based on the US Census Bureau data.
“We included many authoritative data providers in our data feeds to take advantage of their live streaming data services so that we could deliver a comprehensive, real-time common operating picture for our EOC,” said Blohm. “The beauty of ArcGIS Online is its ability to easily bring all of that data together to display it and, more importantly, share it.”
“At the city of Salem, we embrace using ArcGIS as a platform. Without that, I don’t think we would have had the success we did on this exercise,” concludes Blohm. “You have to use all of the different components of the platform in order to have a complete picture and develop a successful EOC program. This was a fast-track project and we were able to stand it up quickly and easily.”
About the author