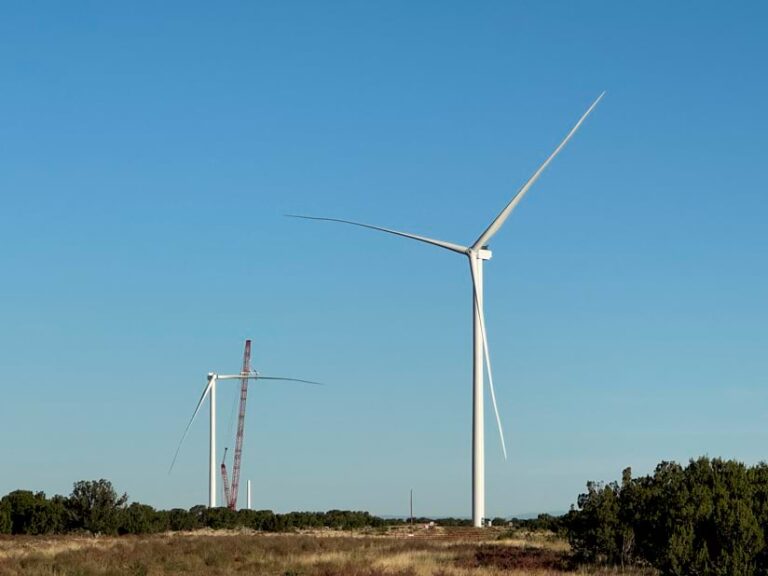
In 2023, construction kicked off in New Mexico and Arizona on the largest wind energy project in the Western Hemisphere. Pattern Energy’s $11 billion SunZia will provide 3,000 megawatts of clean energy from 916 wind turbines, and its 550-mile transmission line will carry enough power for three million Americans when it comes online in 2026. Not only do the region’s consistently high wind speeds make it a fantastic source of wind power, but the demand for this type of renewable energy is close by.
“The shape of power makes a good match between the source of power in New Mexico and the market across the Southwest,” said David Janssen, project director of engineering and construction at Pattern Energy. “As the sun goes down in California and Arizona and the solar panels are going offline, the wind is picking up in New Mexico.”
SunZia has been years in the making, and every step was meticulously planned. The size and complexity of the project required using GIS technology at an enterprise scale from the start. Along with volumes of data and drones equipped with Site Scan for ArcGIS, a shared mapping solution called Maps to Megawatts, developed by Esri partner Aegean Energy Group, has helped manage all phases of the project.
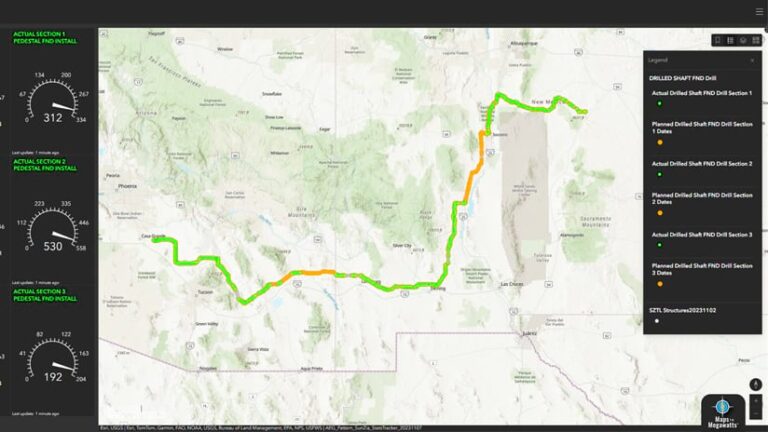
Maps to Megawatts is a software-as-a-service (SaaS) solution created with ArcGIS Online that is specifically designed for renewable energy development projects. It incorporates software such as ArcGIS Dashboards and ArcGIS Hub to more efficiently communicate geographic information. Pattern Energy uses the SunZia Maps to Megawatts ArcGIS Online instance to create web applications that support environmental impact assessments, site selection, transmission routing, and construction. The solution aggregates data using dashboards that track progress and helps coordinate the many project phases.
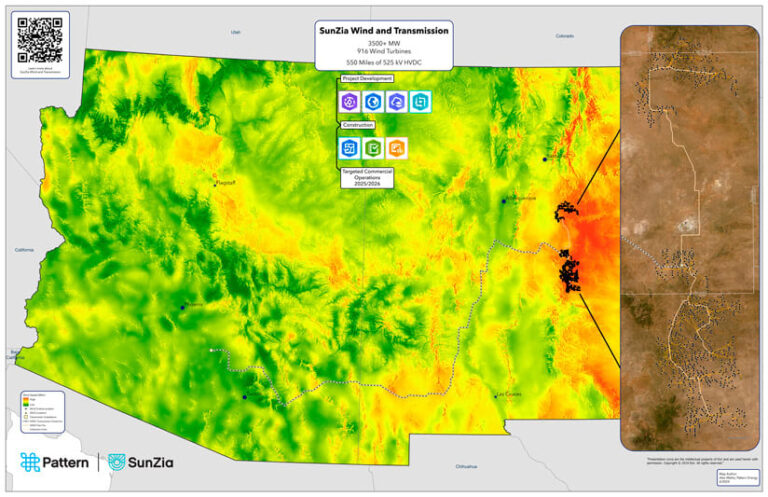
“We have dashboards tracking construction progress, showing captured drone imagery in relation to the design, and dashboards we’ve shared with the Bureau of Land Management [BLM] that track environmental information,” said Michelle Pruse, director of geospatial technologies at Pattern Energy. “We also have various applications that tracked our land acquisition progress and visualized specific constraints on individual parcels.”
Mapping Out Sites and Paths
The SunZia Wind and Transmission project began over a decade ago with the mapping of land parcels. The real estate team recorded details about ownership, land use, water rights, utilities, geology, and more. Surveyors added precise locations.
To find the best wind pad sites and transmission path, the land was analyzed for terrain, protected habitat, fragile environments, and proximity to homes. Mapping the cultural heritage sites of Indigenous tribes was also of paramount importance. Maps to Megawatts enabled planners to consider all these factors, as well as calculate costs to find optimal sites and corridors.
While the wind project stretches across counties, and the transmission corridor spans two states, the area under analysis was much larger.
“When you kick off a project, you think you have a ton of available land, but then you start overlaying all of your constraints,” Pruse said. “It’s a little eye-opening to go from a giant slice of the state down to what you can actually use.”
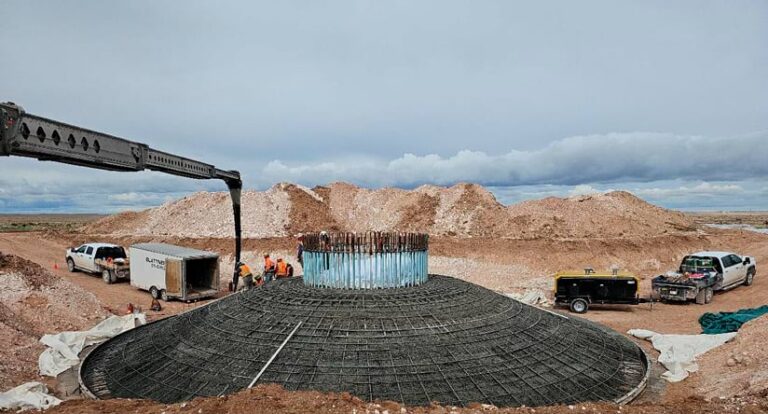
The project’s success depends heavily on cooperation and coordination with government agencies, Tribal Nations, and private landowners. Detailed maps guided conversations and deliberations before Pattern Energy could obtain the necessary permits to proceed.
To achieve route approval, dashboards in Maps to Megawatts were used to help create environmental impact statements required by the National Environmental Policy Act.
“Our environmental teams worked closely with BLM to make sure that we have all of the information that we need in order to analyze those areas and make sure that we’re not encroaching on anything we shouldn’t,” Pruse said.
Because the line goes through a national wildlife refuge, the US Fish and Wildlife Service is also a stakeholder.
“Having all of these different types of landowners isn’t typical,” Janssen said. “GIS helps us identify the specific needs of each landowner and have a common approach that crews in the field can navigate and understand.”
Guided Construction
After the site locations were solidified, the design and permitting teams worked to match their plans with the constraints at each site. Engineers improved designs for both the wind and transmission towers. They recorded details for each tower’s unique foundation and made plans for earthmoving to allow stormwater drainage or establish access roads.
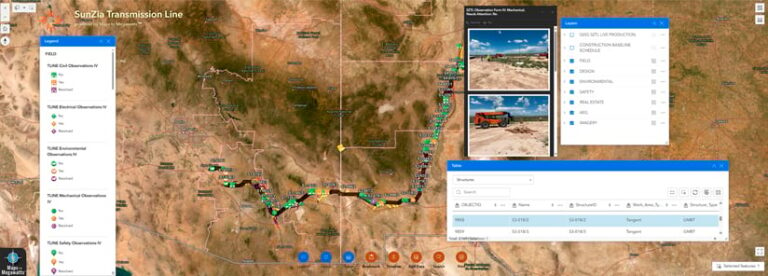
The Maps to Megawatts solution captured details of all the 2,100 transmission tower structures along the line, each with a custom design. The transmission line project will employ more than 1,000 construction workers across three teams deployed to different sections of the route.
Now that the project has reached the construction phase, work crews have embraced GIS-powered apps to navigate and document the work. Each tower has specific access requirements. For instance, some can only be reached
by helicopter.
“Being able to visualize work areas, and look at access routes and constraints, allows us to be more efficient,” Janssen said. “It beats getting everyone in a truck to drive out to do a review, and then looking at pages and pages of drawings to sort it all out.”
More than 50 inspectors review construction to ensure that all parts of the project align with environmental and operational standards. Drones and on-the-ground observations from crews capture every move to manage risks and ensure careful environmental compliance.
“GIS influences what everyone is doing in the field,” Janssen said. “About a tenth of the crew are using a tablet, phone, or laptop to make observations, take photos, create production reports, or look up data. When someone finds something that’s helpful for them, they can share that with the rest of the group.”
Navigating Barriers to Construction Progress
With millions of dollars spent on construction each day, the cost of delays compounds quickly. Whenever something stands in the way, drones and the data in the GIS solution help the team plan around it.
Drone imagery, captured and processed using Site Scan for ArcGIS, helps the crews see whether fences and roads are in good condition or in need of repairs. The crews use this imagery to evaluate changing conditions, such as the effects of monsoon rains. It also helps track movements of material, including calculating the amount of earth moved to flatten the terrain.
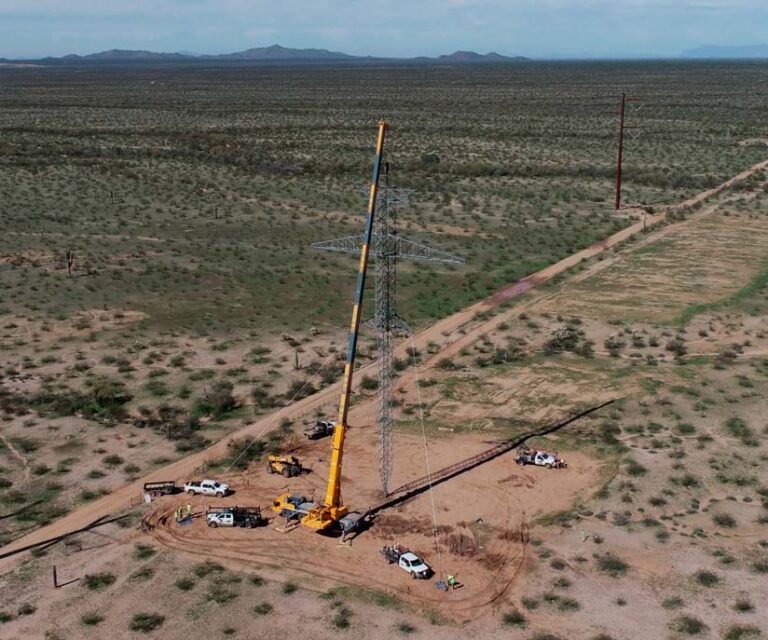
Some tower sites are still under review, causing concern about construction delays. “GIS has allowed us to analyze those areas and come up with workarounds and resequencing to keep our crews engaged and not just sitting at a locked gate waiting for someone to open it,” Janssen said.
Drone imagery also enables real-time collaboration between the field and the office, especially when potential delays arise. One BLM permit requirement, for instance, called for the relocation of all cactus and endangered plants, and drone imagery eased the effort.
“If we’ve got a problem that comes up, we can all look at the drone data to talk about it intelligently,” Janssen said. “We’ve got people on the ground tagging and identifying saguaro and other cacti, then crews go pick them up and move them out of our right-of-way. By looking at the imagery before and after, we can see which cacti make it through the move and which might need some help.”
Creating a System of Record to Guide Operations
The careful collection of construction data and an accurate record of what was on the land before construction started will also support the ownership and operation of SunZia.
“We’ve taken a photo of every single crack that looked like it was susceptible to any kind of damage during construction,” Janssen said. “That crack may come back to be a big deal 10 years down the road.”
GIS records of project construction will be useful for at least the next 20 years. These records will guide the operations team in its upkeep of wind turbines and transmission lines and stations when the project is officially handed off to that team.
“Having the common GIS platform makes that job so much easier for us,” said Janssen. “We have the data already assembled, and the construction observations packaged up. This helps the operations team digest it and get up to speed on the project.”
Well before construction started, Pattern Energy’s SunZia project was praised for its many potential benefits. These included creating good-paying jobs, lowering energy costs, stopping power outages in the face of extreme weather, and accelerating the transition to clean energy. However, it took 15 years for the utility-scale energy project to finalize all the necessary approvals.
“What gets the most attention in the industry seems to be the length of time it’s taken to bring this to market,” Janssen said.
The many agencies involved in the project in different jurisdictions had a lot to do with the long delay. But other clean energy projects have also faced long development timelines, leading to calls for bipartisan legislation to reform the permit process.
From Pattern Energy’s perspective, the documentation of end-to-end workflows could speed future permitting and construction. If regulators embraced technology and used GIS-powered digital twins for approvals and oversight, inspections could happen remotely with online approvals. This level of modernization would be in-line with a growing local government trend to electronically process permits and enforce requirements via online tools.
“We are hoping some of the lessons we’ve learned during permitting and construction—collaborating with GIS—can help us streamline the environmental review process so we can be more efficient,” Janssen said.
