You’ve put the finishing touches on your layer, web map, or configurable app. You’re ready to share it with the world, right? Well…maybe you are if you’ve been updating your item’s Details page as you’ve been working. If you’re like me, you leave this important step until the end. Don’t omit it.
What Is a Details Page?
The Details page is the place where you let other ArcGIS users know what your item—your layer, web map, or configurable app—is all about. The title, the summary, and the description answer the question, what is this? in progressively more descriptive ways. The Details page is also the place to provide the source, the terms of use, any data footnotes or field definitions, and the general metadata that would be hidden when viewing the item.
Every ArcGIS Online Item Has a Details Page
Layers, web maps, scenes, configurable apps, story maps, even tables and images that have been uploaded to your ArcGIS account all have a Details page. A very common workflow is to first author a data layer, then create a web map from this layer, then display the web map along with some context in a configurable app or story map. The layer, the web map, and the app each have a Details page. Ideally, each Details page has been filled out—not just the Details page for the app. That way, the building blocks of your app—the layers and web maps—can stand alone. This can be helpful when a colleague or external GIS user wants to use a part of your app or story map.
ArcGIS Online provides some basic guidance on the page with the scoring bar. Rather than providing specific numbers, the scoring bar simply displays progress on a spectrum from low to high. If your page is scoring on the low side, it lists suggestions for top improvements.
Why Document Your Item?
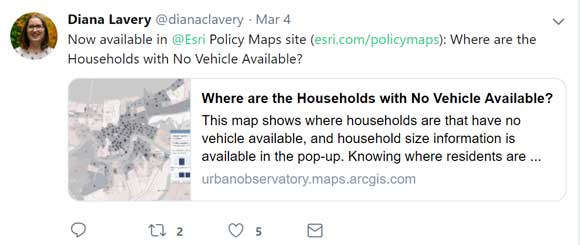
Those who use your item will thank you! A complete Details page for every item not only makes your work easy to find, understand, and use by others but it also makes your item more credible. And it’s required when nominating an item for inclusion in ArcGIS Living Atlas of the World and it makes your web map social media ready. For example, when I shared a map entitled “Where Are the Households with No Vehicles Available” on Twitter, the title, image, and blurb right from my Details page were picked up by Twitter.
Six Tips to Document Your Item
1. Document as you work.
It’s part of the process when publishing a layer or web map from ArcGIS Pro, as you’re prompted for the basics such as title, tags, and summary before your item even exists in ArcGIS Online. Similarly, when creating a new item or adding an item from your computer, you are prompted for tags and a summary. You could skip this step in the moment, but by filling it out immediately, you will avoid having to go back and do it later. If you’re unsure of what your final title or summary will be, that’s okay. You can always edit it later.
2. Cite the original data source in the Credits (Attribution) section.
Be a responsible data user. Give credit where credit is due. Doing this makes your item look more trustworthy. Providing a link to the original data source in the Description section could inspire other users who want to build on your work. Besides, including the source moves that scoring bar toward the high end.
3. Think of someone who comes across your item online.
What information would you need to tell that person about your work? Why is this item valuable? Is there jargon or acronyms that are obvious to you that may not be so obvious to a lay audience? Are there any acronyms that you can spell out in the description? Are there any field definitions or data footnotes that should be noted?
4. Choose effective tags that make your item discoverable.
What question does your item answer? This can be a great place to start thinking about tags. For example, my map on the teen employment rate answers questions about youth, the workforce, labor supply, and even policy—those are all great tags. There might be reasons to use the geography level, such as census tracts or counties, as tags. Similarly, there might be a reason to include the source as a tag.
Review any tags that have been automatically generated. If you’ve performed analysis or geoenrichment, you will have automatically generated tags such as analysis result or enriched layer. While these tags are often helpful to the map author, they are not helpful to the viewer of the final web map or app, so delete them as appropriate.
5. Take the time to make a nice thumbnail.
This is especially important for top-tier content that you share publicly. A picture is worth a thousand words, right? For best results, the thumbnail should be 600 by 400 pixels.
6. Use markup, formatting, indentation, color, and images to your advantage.
It’s easy to change the color of text in the Description section so that it can match your legend, or even add images.
Let’s look at some tips for web maps, apps, and story maps.
Web Maps
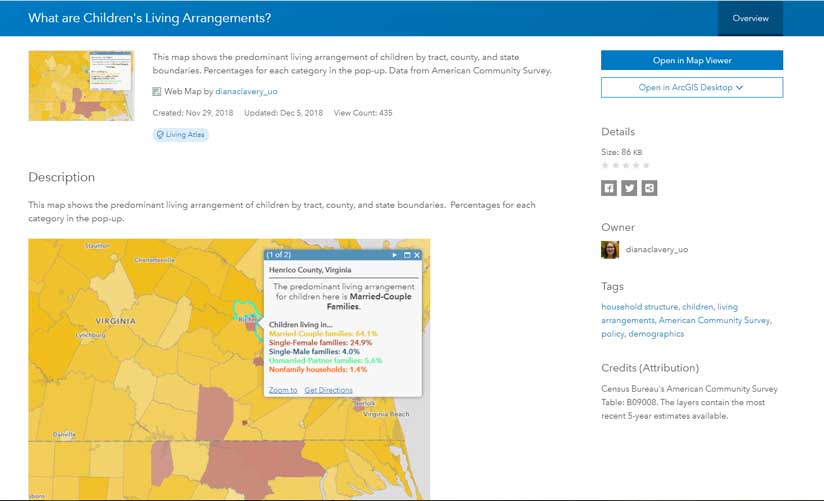
My web map, What Are Children’s Living Arrangements?, displays the predominant type of family by state, county, and tract. By taking a screenshot of this map with an open pop-up, hosting it as an image, and using it in the description, I can communicate the legend and pop-up information at the same time.
Apps and Story Maps
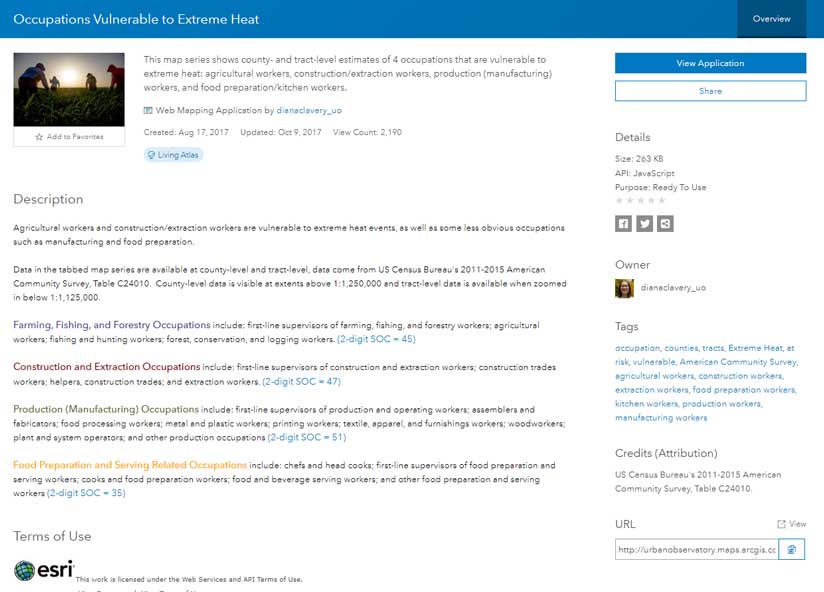
Occupations Vulnerable to Extreme Heat, a tabbed story map, shows four different categories of workers, one tab for each category, and then a final predominance map showing all four. The app’s Details page uses the same color map as the ones used in the map for the details about each occupation category, with links to the authoritative source on occupation definitions.
More Reasons to Love the Details Page
Up until now, I’ve discussed only the Overview tab. There’s also a Usage tab that lets you track the number of views your item is getting. The Settings tab lets you turn on delete protection, mark the status, set the extent, and control the user experience for your item. For layers, a Data tab and Visualization tab let you do some quick checks without having to open the layer in a map. All the metadata on the Details page helps you as the item’s creator and helps others collaborate across the entire ArcGIS platform.
For more information, visit the ArcGIS Online documentation topic “Item details.”