Geostatistics Portal benefits public and private sectors
We live in a global village. We can transfer and share information and localize it spatially. However, information must be readily available, quickly accessed, and simple to interpret. Social, trade, and government portals are created with this in mind. Sharing data that has been collected contributes to the creation of an information society. The Republic of Poland is developing the Geostatistics Portal, which collects, presents, and shares statistical data.
Throughout the world, collecting and processing data are performed by national statistical offices. These offices are tasked with providing reliable, fair, independent, and high-quality statistical information on the current state and changes in society, the economy, and the environment for use by domestic and international audiences. Public statistical institutions collect, store, and analyze statistical data and share it as resultant statistical information.

Using GIS in Government Statistics
Until now, the Central Statistical Office of Poland (CSO) disseminated statistical data on its website as statements and announcements made by the CSO president. These announcements were also published in the CSO Official Journal and the Official Journal of the Republic of Poland, Monitor Polski), and distributed as press releases at the CSO president’s press conferences and in publications. Data was also disseminated in databases and data banks that range in scope from the narrowly focused Demographic Database to the more general Local Data Bank.
Using GIS technology in the Agricultural Census 2010 and the Population and Housing Census 2011, both nationwide censuses, provided georeferenced statistical data that can be presented on the Geostatistics Portal.
During the last few years, GIS use for official statistics has increased. This was a byproduct of European Commision (EC) regulations. In 2007, the Directive 2007/2/EC of the European Parliament and of the Council of 14 March 2007, establishing an Infrastructure for Spatial Information in Europe (INSPIRE), came into effect.
This directive was incorporated into Polish law on March 4, 2010, as the Spatial Data Infrastructure Act. The act defines the basic principles for the creation and development of a spatial data infrastructure (SDI) in Poland. This SDI will function on all levels of public administration and serve all spatial data users in Poland and the EU. The INSPIRE Directive and subsequent SDI act defined the spatial data themes and public authorities responsible for publishing datasets and services used in these themes. The president of the Central Statistical Office of Poland (GUS) is responsible for two of these data themes, the statistical units and population distribution (or demography).
Apart from the requirements of INSPIRE, Eurostat has noted that georeferencing statistical data and using an innovative web application to publish the data greatly increases value of the final product as well as creating new data. One of the goals of the European Statistical Programme 2013–2017 is support for the development of fact-based policies through wider use of georeferenced statistical information on society, the economy, and the environment.
While preparing for the census, use of GIS statistics increased. In 2009, paper statistical maps showing statistical division borders were scanned and calibrated. The boundaries of statistical regions and census enumeration areas were digitized, and the acquisition of statistical address points (i.e., dwelling locations) began.
Digital maps were used in both censuses for updating the statistical address point database for municipalities. A dedicated web application allowed municipality authorities to view and edit address point positions on a map. A precensus visual survey delivered as a mobile application on a smartphone used the GPS receiver that let enumerators determine their location as well as view and edit address points on a map. The census itself used a dispatcher application for monitoring and coordination.
A Management Tool
A modern solution for the spatial presentation of statistical data, the Geostatistics Portal collects, presents, and shares information with a wide audience that includes public administrators, entrepreneurs, and individual users as well as scientific researchers. All data for this comprehensive solution data is processed to retain statistical confidentiality and conform to European standards.
The Geostatistics Portal is helpful for making strategic decisions on all levels of management. The project contributes to the establishment of a complete and coherent e-administration system that supports the development of entrepreneurship by facilitating access to current information on the social and economic status of the country. This is of strategic importance for society and the national economy. A given area can be monitored and analyses and simulations performed to generate forecasts, estimate risks, and develop preventive measures.
Building the Portal
Through a tender process, CSO staff selected Esri partner GISPartner Sp. z o.o. of Wrocław, Poland to develop the Geostatistics Portal. The company has considerable experience developing large spatial information systems.
The Geostatistics Portal was created using state-of-the-art solutions from GISPartner and Esri. It consists of a central database based on Microsoft SQL Server and ArcSDE software, metadata catalog, data server, and spatial services based on ArcGIS for Server technology, ArcGIS for Desktop, and the iMap map portal designed by GISPartner Sp. z o.o. The portal provides access to Web Map Services (WMS) published by other servers.
The system has a multilevel architecture. At the first level, servers perform load balancing that ensures failure-free and optimum operation as well as an even load on all servers. In addition, servers are set in a failover cluster, a system configuration designed to sustain critical system tools. [In a failover cluster, independent computers are grouped so they work together, increasing availability and scalability.] Without high accessibility, many services could not be maintained.
At the next level, application servers receive system traffic. If a server fails, it is automatically turned off by the load balancer. A database cluster, based on a Microsoft solutions failover cluster, is at the third level. At any point in the system, its efficiency can be increased or its configuration changed while maintaining the existing hardware infrastructure or expanding it.
Maintaining the security of the collected data and its statistical confidentiality was an important aspect of the system. Consequently, many solutions were applied to the hardware infrastructure, software, and functionality of the system. All geostatistical data is kept on database servers that can be directly accessed only from the internal GUS network. Access to the system’s advanced functions requires a system account.
Functionality and Scope
The Geostatistics Portal is a tool for interactive cartographic presentation of census results. The results were developed in the Analytical Microdata Database (AMD), which uses IT tools to generate various data reports such as tables and multidimensional cubes. Aggregated data was prepared for the Geostatistics Portal in AMD. The aggregates have been replicated to a database in the portal.
Statistical data in the Geostatistics Portal is presented on predefined basemaps that contain orthophoto map, administrative division, statistical division, locality centroids, and street network and address points layers. The two latter layers are available only to internal users (i.e., registered users).
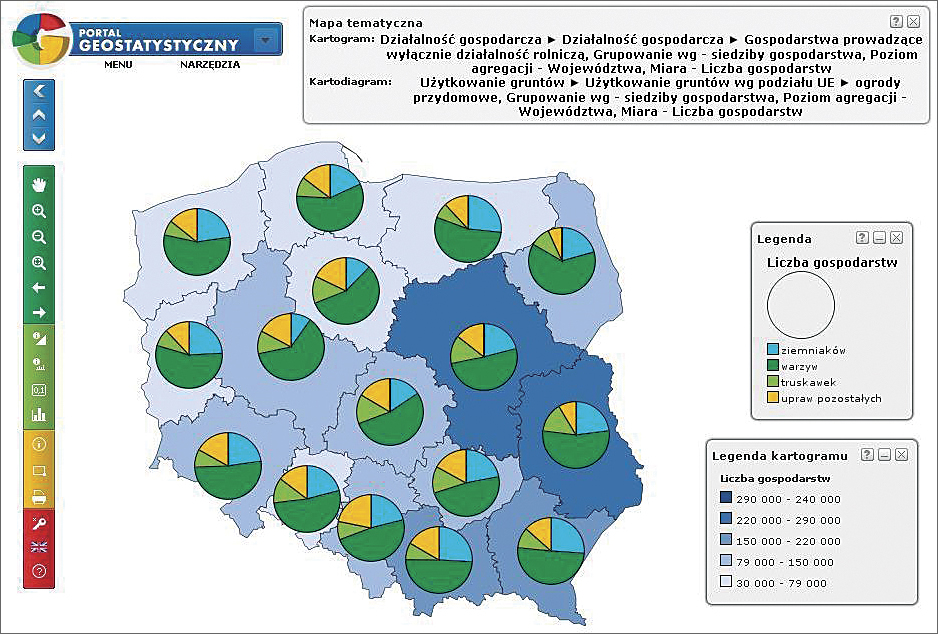
The Geostatistics Portal’s intuitive user interface allows quick and easy access to statistical information. Portal users can select a thematic phenomenon from a predefined list or find it using a search engine. Data is presented using cartographic methods such as choropleth maps and diagram maps. Circle, bar, proportional and/or structural, and complex diagram maps are used.
For presentations of all types, users can define visualization parameters, such as aggregation level (e.g., territorial unit) of the output, as well as the following (if applicable): symbol, color range, number of classes, and classification methods. For all thematic phenomena, users can generate table statistics and histograms.
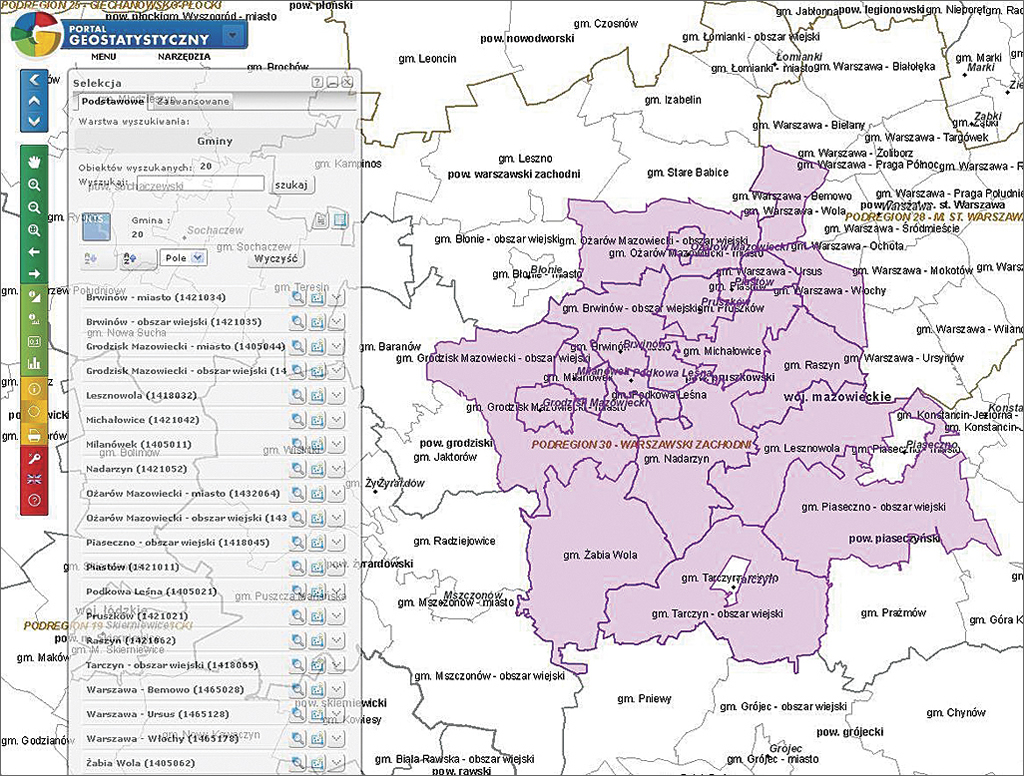
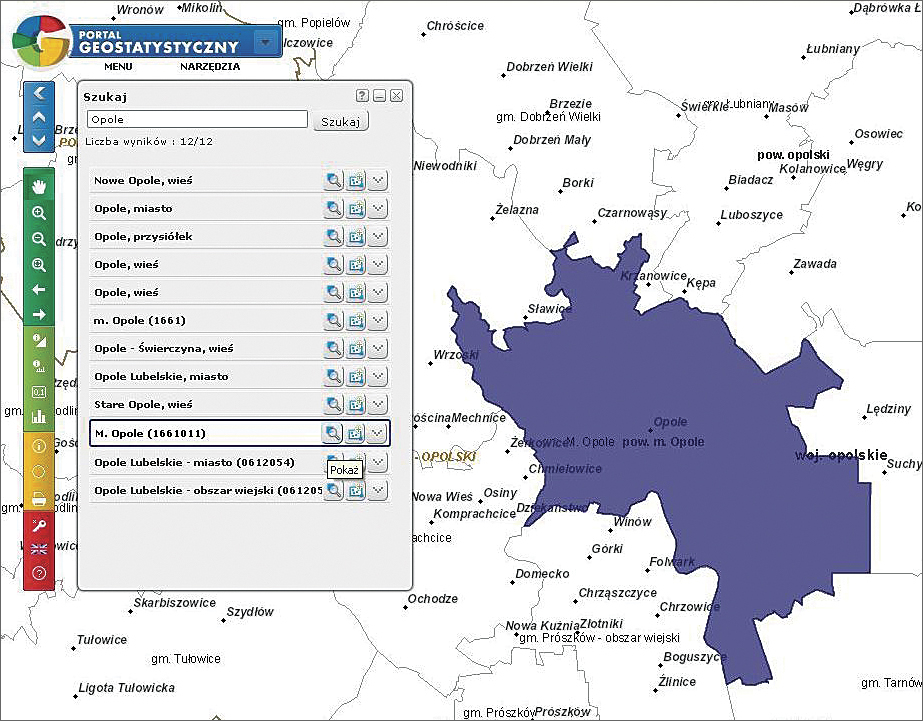
Users also have at their disposal tools such as object identification, object selection, locality search, address search (accessible to internal users), and attribute and spatial search tools. A specified map extent can be printed or exported to various file formats. The portal is also compliant with Open Geospatial Consortium, Inc. (OGC), web services. WMS services can be added to the map window.
Apart from predefined spatial analyses, internal users can prepare their own thematic maps based on any feature of the data model using multidimensional spatial analyses, (e.g., line analysis, distance analysis, or buffering).
To fulfill obligations of the INSPIRE Directive, an INSPIRE Services Subsystem was created as part of the Geostatistics Portal. It provides access to data and metadata related to statistical units and population distribution (demography). The subsystem is composed of a metadata catalog and discovery, view, and download web services.
The portal will provide access to a wide range of thematic phenomena.
Results of the Agricultural Census 2010 can be viewed on 550 choropleth and diagram maps grouped in 10 main topic areas: income, economic activity, income structure, use of equipment, sown area, land use, farm animals, economic activity of people in individual holdings, and the workloads of individuals on those holdings.
Results of the Population and Housing Census 2011 can be viewed on 2,000 choropleth and diagram maps grouped in 39 main topics.
Expansion Project
Currently, the Geostatistics Portal presents only census results. In the future, CSO will provide access to georeferenced results of other surveys from the official statistics survey program. The project will need to be expanded to accomplish this. The Geostatistics Portal Expansion project was submitted to the Integrated Computerization of the State Programme in the 2014–2020 budget projection.
Until now, statistical survey results have been published at the administrative division level (e.g., voivodeship [province], county, municipality). In the Geostatistics Portal expansion would implement other territorial divisions such as kilometer grids as specified in the INSPIRE Directive executive legislation. To facilitate this, it is essential to collect statistical data with a spatial reference—preferably to x,y coordinates or at least an administrative or statistical territorial identifier.
The power and uniqueness of the Geostatistics Portal lies in its characterization of aggregated data, contained only in official statistics, and the presentation of this data in a georeferenced format that preserves data confidentiality for individuals.
For more information, contact Agnieszka Nowakowska at Central Statistical Office or Marta Orłowska-Krzyźyk at GISPartner.
About the authors

Janusz Dygaszewicz

Agnieszka Nowakowska