As part of its disease mapping efforts in India, an independent not-for-profit organization prototyped a process for digitizing health facility data so GIS could be applied to facility planning to improve health outcomes.
Disease mapping has become an important tool in health care decision making. Disease mapping informs policy makers and health professionals about the spatial distribution and patterns of health-related events and their underlying relationships to populations.
However, proximity and access to health care are also important determinants of health outcomes. This is certainly the case in India, where health disparities are especially pronounced, with many and varying causes. While disease mapping identifies areas of high and low incidence of disease, mapping access to health care can uncover some of the reasons behind the clustering of disease outbreaks and their impact on mortality.
While developed countries have created and maintained good data on the location of health facilities, developing countries lack this valuable data. It is either nonexistent, incomplete, or—if available—cost prohibitive for researchers.
Studying Factors Relating to Outcomes
To address this situation, the Centre for Global Health Research (CGHR) hand digitized health facility locations in India using input data from various sources. CGHR was founded in 2002 on the principle that effective health initiatives must be supported by reliable, evidence-based research. It conducts large-scale epidemiological studies in developing countries that support its mission to lead high-quality public health research that advances global health, with particular attention to the world’s poorest populations. CGHR is cosponsored by St. Michael’s Hospital in Toronto and the University of Toronto.
The Million Death Study (MDS) is one of CGHR’s major initiatives. In collaboration with the Registrar General of India (RGI) office, MDS surveys 1.1 million nationally representative households to determine the death counts and causes. To complement CGHR’s research on disease-related mortality, GIS techniques are now applied to the study of the impact of the health care system on mortality.
Cause of death (COD) reports from MDS provide only the deceased person’s postal code. Joining COD data to an Indian postal code shapefile obtained from GfK GeoMarketing allowed spatial patterns for all deaths or for deaths attributed to specific causes, such as cancer or measles, to be displayed. According to the MDS, most deaths occur in rural areas in India.
Availability and access to health care in villages in India is an important aspect of spatial epidemiology research. While urban populations have access to private health care networks, rural populations rely heavily on the public health system. The rural health system in India has three tiers: Sub-Centers (SC), Primary Health Centers (PHC), and Community Health Centers (CHC). PHCs are the basic health units where the members of a community come into contact with qualified doctors. According to Indian Public Health System, a typical PHC serves 20,000 to 30,000 people and is usually named after the village where it is located. Mapping the location of PHCs would be the first—and most important—step in conducting advanced spatial analysis on health outcomes using COD data supplied by MDS.
Increasing the Value of Village Amenity Data
In late 2011, CGHR’s GIS team obtained village amenity (VA) data from the Census of India for the entire country. This dataset contains data about post offices, health facilities, educational facilities, and other amenities for every village in India along with a village identifier (ID) and some socioeconomic variables. The collection of this data at the village level presents a unique opportunity to map and spatially analyze data at a large scale. However, a big challenge remained—how to obtain data on the geographic location of villages.
After considering various options, the GIS team decided to use the 2001 District Census Handbooks (DCHBs) published by the Census of India. [The GIS team is composed of the authors, Samir Gambhir and Peter Rodriguez, along with Hana Fu, Luka Ding, and Jonathan Critchley.]
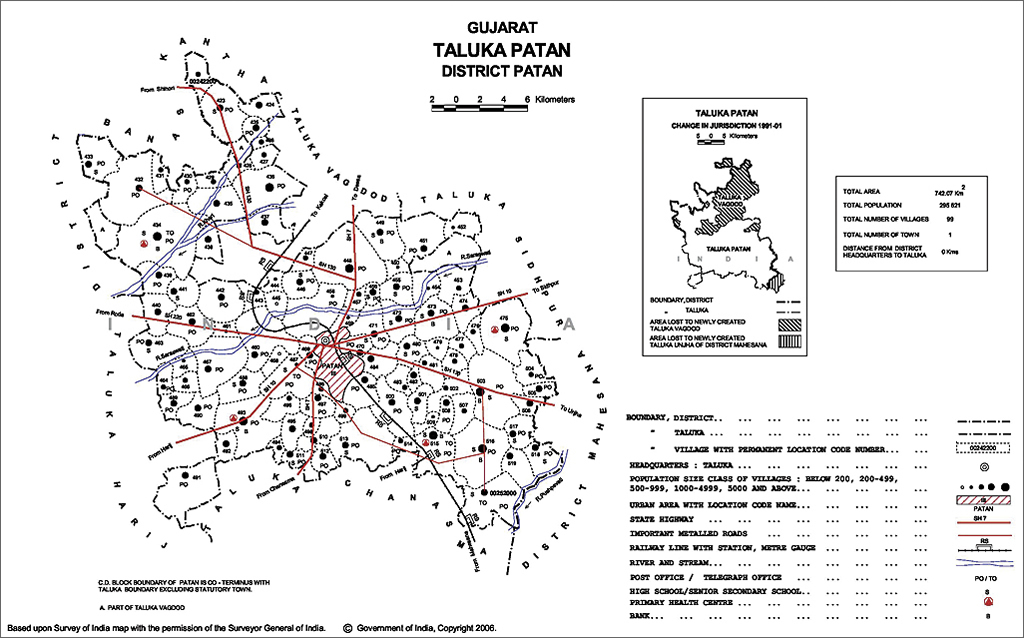
DCHBs provide Primary Census Abstract (PCA) data up to village level for the rural areas and also contains tehsil [local administrative unit] and block level maps showing the location of all villages as points with village IDs. If these village locations could be digitized using these maps in PDF format, it would be possible to append VA data to these locations using village IDs and a shapefile could be generated for any amenity included for PHCs.
Prototyping a Process
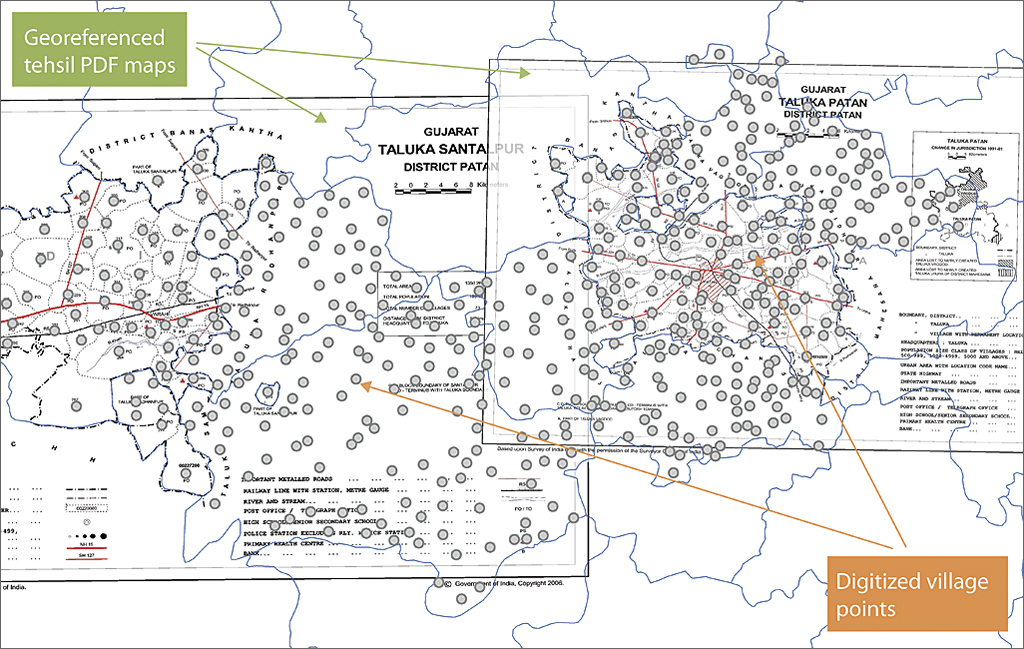
DCHB maps for the states of Madhya Pradesh, West Bengal, and Gujarat were used in this project. Specifically, tehsil- and block-level PDF maps were used to hand digitize village locations. Also, village amenity data for the three pilot states was used. Moreover, a tehsil boundary shapefile downloaded from DIVA GIS was used together with GfK’s district and state shapefiles. Geocoding villages involved converting the PDF maps to an image format (JPEG) and georeferencing the image. The village points were hand digitized using ArcGIS 10.0 for Desktop.
Map georeferencing
Georeferencing maps was done with the aid of a tehsil shapefile. Although this shapefile contains less than 50 percent of the tehsils that existed in 2001, it was nevertheless useful in providing a reference point for these static maps.
Digitizing villages
Villages have unique eight-digit identifiers that run sequentially within a state. Starting from the first district in each state, all village points were digitized sequentially starting with the first tehsil in that district. This reduced the likelihood that any village point on the paper map would be missed. After completing digitizing points for the villages in each tehsil, relevant village, tehsil, or district IDs were added.
Although these maps display town boundaries as well, none of the towns were geocoded during this project because towns are treated as urban areas for census purposes. According to Census of India, a town must meet all three of the following criteria:
- Have a minimum population of 5,000 persons in the preceding census
- Have at least 75 percent of the male working population engaged in nonagricultural activities
- Have a population density of at least 400 persons per square kilometer (km)
Checking Accuracy
Once the village shapefiles were completed, they were compared with VA data to check for duplicates, erroneous village codes, and other aspatial errors. Some village codes seemed to be duplicated due to the nomenclature system implemented by the Census of India rather than any data error. Village IDs are unique within a state but not unique among states. Once these errors were identified, the GIS team ensured that records that had the same village code but belonged to different states were not marked as duplicates. A workaround was used that concatenated the state ID with village IDs to get a unique ID value for each village.
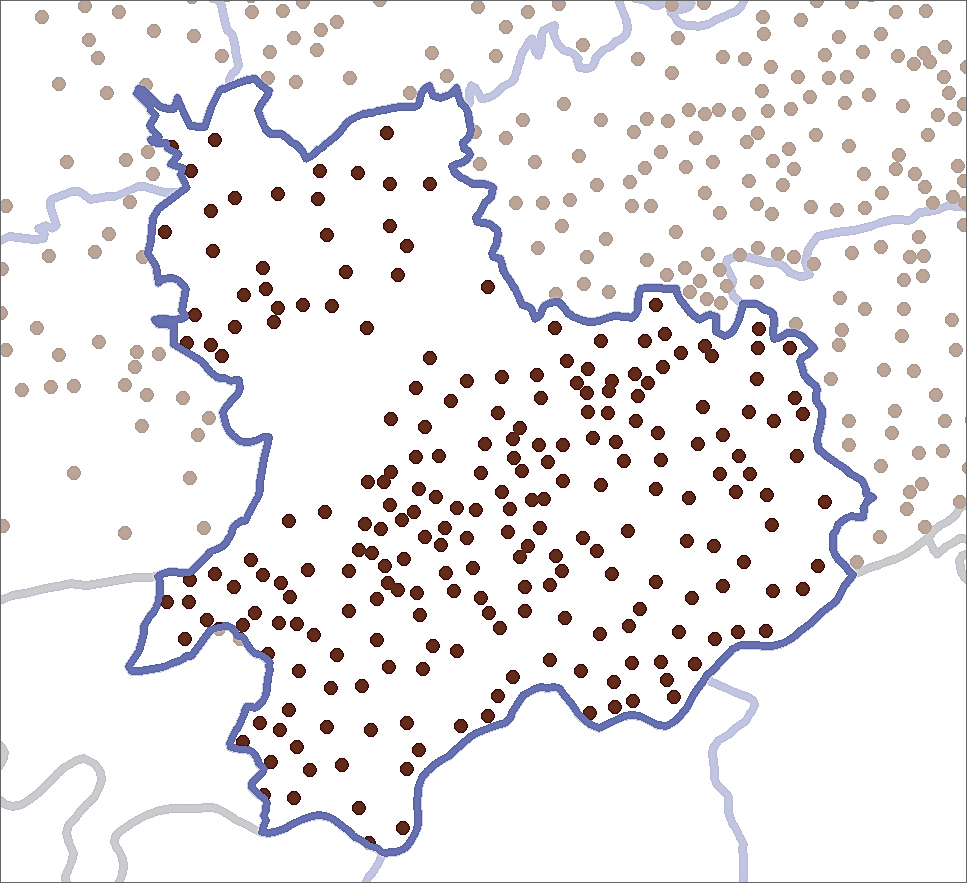
CGHR researchers needed to know the limitations of this spatial data. The methodology and data sources warranted a spatial accuracy check of the geocoding work. Spatial accuracy checks were conducted using stratified random sampling techniques and made use of Google Earth imagery. Four hundred random sample village points were extracted from a shapefile containing locations of villages in Madhya Pradesh in an attempt to identify likely sources of spatial error. The georeferencing process led the GIS team to believe that small villages and villages found close to tehsil boundaries were likely to show a higher number of spatial errors.
The village points from Madhya Pradesh were divided into three population strata, then into three geographic strata:
Population strata by village
- Less than 500
- Between 500 and 999
- Greater than 1,000
Geographic strata
- 100 villages within 1.1 km (0.01 decimal degree) inside a tehsil boundary
- 100 villages from 1.1 km to 3.3 km (0.01 to 0.03 decimal degrees) inside a tehsil boundary
- 200 villages beyond 3.3 km (0.03 decimal degrees) inside a tehsil boundary
Considering the amount of data and the labor-intensive nature of the hand-digitization process, the GIS team decided on 1.1 km as the margin of error. A buffer with a 1.1 km radius was created around each of 400 random points. The resultant shapefile was exported and analyzed for proximity of a human settlement within the buffer. A binary scoring system was devised to record the outcome of this analysis. A score of 1 was assigned if one or more human settlements were contained within the buffer, and a score of 0 was assigned if no human settlements were contained within the buffer.
Spatial accuracy checks revealed that out of 400 buffers for Madhya Pradesh village points, 337 contained one or more human settlements and 63 buffers contained no human settlements. Thus, it can be stated with a confidence level of 99 percent that 84.25 percent (+- 4.71) of village point buffers in Madhya Pradesh contained one or more human settlements. However, this test did not confirm if the human settlements within the buffer were the correct villages. Further analysis and better annotated satellite imagery will help make this test more robust. VA data was joined to this shapefile using the unique concatenated IDs. The availability of amenities for each village was used to create subset shapefiles for PHCs, SCs, and post offices.
Data Sources Challenges
Some of the discrepancies inherent in the PDF maps from DCHBs and shapefiles from various sources might have impacted the accuracy and reliability of this geocoding project. Some PDFs for West Bengal were unusable as they could not be opened, and about 600 villages could not be geocoded.
The PDF maps from DCHBs appear to have some degree of artistic rendering. Due to the amount of information needed to be displayed on these letter-sized maps, it might not have been possible to display all symbols accurately. Some facility symbols, like those for post offices, appear to have been drawn for identification rather than location purposes.
Due to discrepancies in boundary profiles in the shapefile downloaded from DIVA GIS, tehsil and block boundaries on the PDF maps did not match perfectly with the boundaries shown on the shapefile.
Conclusions
This project allowed CGHR to create village point shapefiles for three states in India. The spatial accuracy of these village points was assessed, and the results are encouraging. It proves that the methodology is sound and reproducible. Other developing countries can rely on this methodology to generate shapefiles for research and analysis. To develop a meaningful and useful shapefile, it is imperative to identify the right information sources.
The GIS team believes that the output shapefile generated utilizing this method may greatly assist researchers in conducting advanced spatial epidemiological analysis. This analysis can help policy makers and health officers understand where there are spatial mismatches between disease outbreaks and access to health care; plan health care facilities; analyze the availability and utilization of health facilities; and combine shapefiles showing health facilities locations with terrain characteristics to determine their accessibility, rather than just proximity.
Learn more about CGHR. For more information about this article, please contact Samir Gambhir or Peter Rodriguez.
Other GIS team members involved in this project include Hana Fu (GIS technician), Luka Ding (GIS technician), and Jonathan Critchley (GIS intern for winter 2012).
About the authors

Samir Gambhir