Web-enabled mobile devices are so ubiquitous that they generate almost half of all Internet traffic. To reach a wide audience, web applications need to provide a good user experience whether the browser is on a mobile device or a desktop machine.
However, 3D web applications that work well on mobile devices are not so common. In the past, it wasn’t possible to visualize a point cloud layer or a 3D model of some city buildings on a smartphone. But with the ArcGIS API for JavaScript, developers can now create 3D experiences that work well in both mobile and desktop browsers.
This article highlights several apps that showcase the value of web 3D on mobile devices and gives best practices for building user-friendly 3D web mobile apps that have optimal performance. The first sample app gives information on hiking trails, the second app helps a city planning department share project proposals with citizens, and the third app lets a newspaper tell a story more effectively with interactive graphics. Use the accompanying URLs to explore the capabilities and design of these app.
Take-Along Hiking App
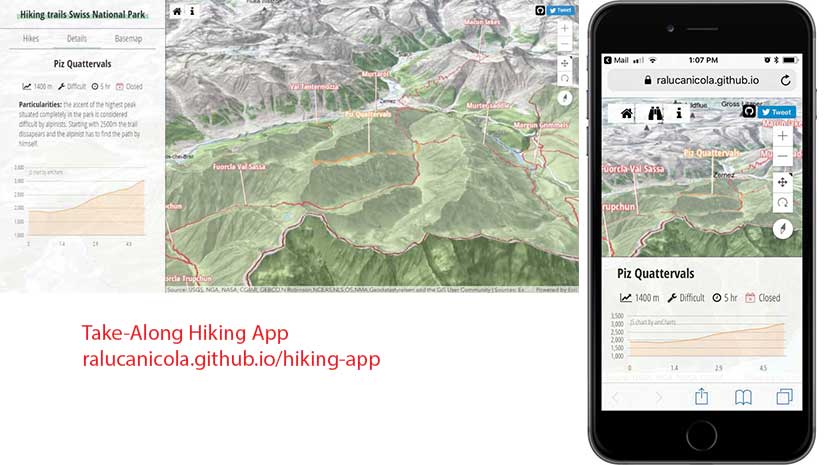
The hiking trails app lets visitors to the Swiss National Park plan trips by providing information about the park’s hiking trails that can be viewed on a desktop or a mobile device. Visitors use the mobile web app to view their progress along a trail whenever they have connectivity during their hikes.
Gathering Community Feedback
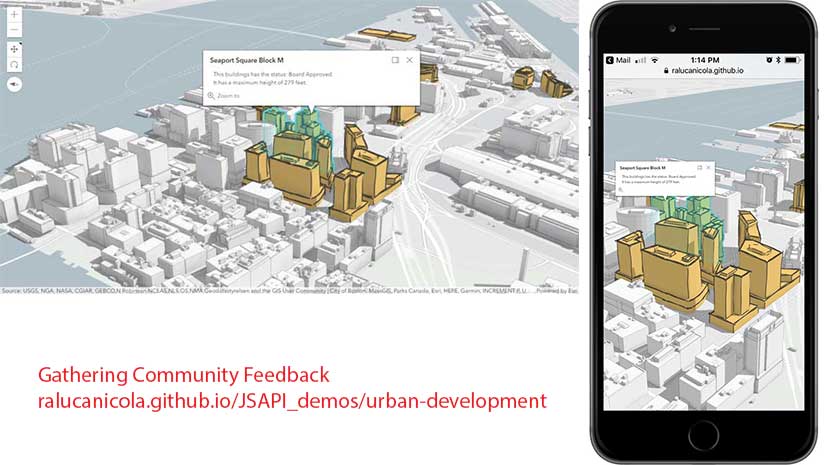
The planning department of a city created a 3D web application to present several new project proposals to its citizens. To get community feedback, the department shared the app on social media platforms. Since most people access social media on mobile devices, the web app had to be mobile friendly.
Telling the Story with Interactive Graphics
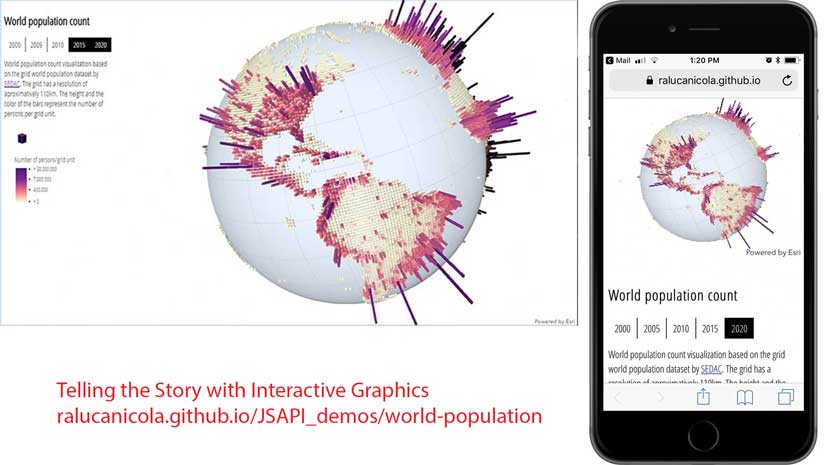
The world population count app was created to visualize data from the Socioeconomic Data and Applications Center (SEDAC). Newspapers often have online versions of articles that use interactive graphics to tell more of the story. Because many readers look at online articles on smartphones while waiting or commuting to work, any graphics used in online versions must display well on a phone.
Best Practices for 3D Performance
These apps are examples of mobile web apps that provide good performance despite hardware and bandwidth constraints. Complex rendering requires more memory and processing power, so it’s important to consider how to optimize how resources are used.
Some of these best practices include
- Efficiently managing layers.
- Employing a lower rendering quality profile.
- Using lower-resolution textures for rendered objects.
- Optimizing how features are displayed on terrain.
- Simplifying the geometry of rendered objects.
- Minimizing initial load time.
Efficiently Manage Layers
ArcGIS API for JavaScript visualizes data in 3D by loading the layers that have been defined as part of a web scene. Web scenes can be authored with ArcGIS Pro, ArcGIS Online, or programmatically with the ArcGIS API for JavaScript. To optimize performance, limit the number of layers in a scene to less than 12 because each layer must reserve memory. Consider merging or combining two or more layers that are logically similar and share the same geometry type. Reducing the number of visible layers minimizes the CPU and GPU overhead. Only make visible the layers that are needed. Last but certainly not least, add scale dependency to web scene layers. This can have a significant positive effect on display performance.
Employing a Lower Rendering Quality Profile
Profile settings incorporate a variety of graphic options such as map resolution, scene detail level, and anti-aliasing. Using a lower-quality rendering profile can maximize performance. The ArcGIS API for JavaScript automatically detects mobile browsers and will use a low-quality profile by default unless configured otherwise.
Using Lower-Resolution Textures for Rendered Objects
Most city visualizations have a scene layer with 3D building models. Building models can be memory intensive, so avoiding high-resolution textures will allow for better performance on mobile devices. Consider omitting textures altogether if they do not contribute to the objective of the web application.
Optimizing How Features Display on Terrain
For apps like the hiking one, aligning features to terrain is important since elevation plays a key role in understanding the trail. There are multiple elevation modes in 3D that will align features to the ground in different ways. The on-the-ground elevation mode turns the feature layer into a texture and drapes it on the ground. The relative-to-ground elevation mode will display the line as a vector, but it will align the geometry to the elevation surface. Using relative-to-ground is more resource intensive because it computes the elevation at each vertex of the geometry to align it to the terrain. The hiking app used on-the-ground because it displays well and requires fewer computations.
Reducing Feature Complexity
Simpler shapes with fewer vertices render more quickly. Data can often be more complex than necessary. See whether the level of feature complexity can be reduced by thinning out dense data and reducing the number of vertices. This is accomplished by simplifying or dissolving lines and polygons in ArcGIS Pro. When visualizing lines, 2D lines render faster than 3D tubes. Optimal performance can be achieved by ensuring that building geometry is not too complex: the fewer vertices, the better.
Shadows and ambient occlusion are great ways to enhance the perception of the third dimension in urban visualizations, but they can be very resource intensive for mobile devices. [Ambient occlusion is a lighting model that calculates the brightness of a pixel in relation to nearby objects in the scene.] Turn off shadows and ambient occlusion on mobile devices. Use these effects only when the app is run on a desktop.
Visualizing Data at a Global Scale
When visualizing data at a global scale, the terrain is often unimportant, so you can simply remove the ground from the web scene. While flat symbols perform the best in a 3D scene, volumetric symbols can be much more compelling. For example, in the case of the world population app, it is better to use volumetric symbols with fewer faces. Because spheres and cylinders are complex objects, it is better to use cuboids or tetrahedrons for thematic visualizations.
On-Demand Data Loading
Because network bandwidth can be limited, it’s important to consider optimizing your app’s initial load time by lazy-loading data. Rather than loading everything during the initial app load, the app makes several requests on demand. The Swiss National Park hiking app uses this approach, making several requests on demand after the user selects a hiking trail. Elevation data is requested to create the elevation profile. The georeferenced Flickr images are queried using the Flickr API. If the user clicks on the same trail a second time, the data is already cached in the browser and the application only needs to display it.
Performance Testing and Mobile Devices
Important enhancements have been added to the ArcGIS API for JavaScript in the last year that improve overall performance in mobile browsers. These updates, combined with the best practices outlined in this article, will help you provide a rich 3D experience for users of your web apps. The following mobile devices are officially supported: Apple iPhone 8, Apple iPad Pro 2, Samsung Galaxy S8, Samsung Galaxy S9, Samsung Galaxy Tab S3. However, web apps created with the API are being used on a range of devices.
Performance testing of your app is critical. The more devices you can test on, the better. If you don’t have access to all the device types your end users will be using,there are some great software tools for measuring performance. For example, in the Audits panel in Google Chrome Developer tools, you can select either Mobile or Desktop to run performance tests on your app and rate compliance with Progressive Web App (PWA) standards, accessibility, and best practices.
Providing a Better User Experience
In addition to best practices that are specific to designing 3D apps, more mobile-first and PWA approaches yield superior results when designing any mobile app.
Instead of initially designing a full-size desktop app and then creating a mobile version of that design, start by designing for mobile. The mobile-first design approach considers the mobile user interface requirements and then adjusts those requirements to accommodate the desktop version. Mobile-first design assumes a responsive interface. The UI automatically adjusts as needed based on the user’s screen dimensions, so the user experience is good regardless of the screen size.
The ArcGIS API for JavaScript supports responsive design with the widthBreakpoint property. This property defines the breakpoints of a SceneView for screen sizes. All UI components that are attached to the view, such as the legend, will be placed based on the current view width and how the widthBreakpoint property was set.
Widgets are designed to be responsive. For example, when the width of the view is smaller than the API’s defined threshold, the pop-up will be automatically placed at the bottom of the view and will be adjusted to the view’s width.
PWA design takes advantage of new features supported by modern browsers to make web apps even more mobile friendly by making them behave more like native applications—reliable, fast, and engaging.
A browser service worker is used to cache the required data and make the application load quickly and independently of the quality of the network connection. A manifest file is also created to provide all the necessary metadata so that users can install the web application on a phone’s home screen.
The Swiss National Park hiking app uses PWA. It can be installed on the home screen of a phone, and it doesn’t break if the network connection is briefly lost. Note that this app is designed for intermittent connectivity. For a fully offline experience, the ArcGIS Runtime SDKs would be a better choice.
Conclusion
Using the ArcGIS API for JavaScript and following the best practices outlined in this article will help you build useful and effective 3D apps that work well on mobile devices as well as desktops.
- Read more on best practices for scene performance at arcgis.com/en/arcgis-online/reference/best-practices-scene-performance.htm.
- To access the API guide and reference and look at code samples, visit the ArcGIS API for JavaScript section of the ArcGIS for Developers site.
- Interact with other JavaScript developers on the ArcGIS API for JavaScript GeoNet
- Learn more about PWA.
About the authors

Raluca Nicola