Existing GIS-based tools used by a Netherlands-based company that helps optimize water use are being ported to a standardized ArcGIS platform.
Two well-established companies in the Netherlands—WaterWatch and Basfood—formed eLEAF to support global solutions for agriculture and the environment with data they collect on vegetation, water, and climate. WaterWatch previously developed PiMapping technology, a family of GIS-based tools that delivers more than 50 data components.
“In the past, the efforts to expand agricultural productivity have focused on the land, commonly measured as a yield per hectare,” said Maurits Voogt, manager of eLEAF Competence Center. “However, with the increasing global scarcity of water resources, the focus is shifting away from the land on which the crop is grown and to the productivity of the water applied to the crop, or a yield per cubic meter.”
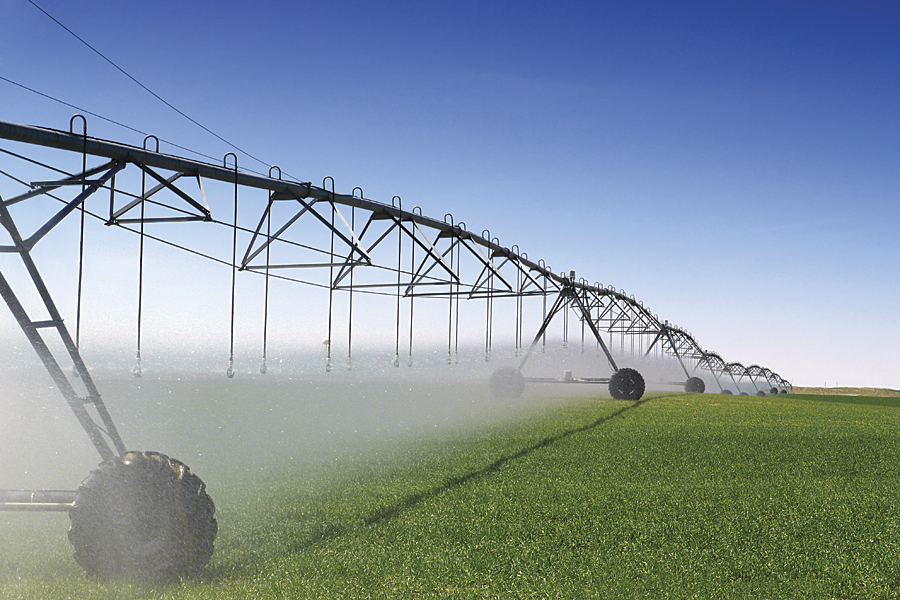
Optimizing crop water use efficiency requires quantitative measurements of crop water consumption. The physical process behind crop water consumption is called evapotranspiration. It is the combination of plant transpiration (the loss of water vapor from plants) and surface evaporation.
Utilizing Remote-Sensing Data
During the mid-1990s, professor Wim Bastiaanssen, a water resources modeling and remote-sensing specialist and founder of WaterWatch, developed the Surface Energy Balance Algorithm for Land (SEBAL) model to calculate crop water consumption from remote-sensing data. The model measures the energy balance that specific plants in a defined area require to sustain the hydrologic cycle. Basically, the energy driving the hydrologic cycle is equal to the incoming energy from the sun minus the energy reflected back into space and the energy used to heat the surrounding soil and air.
The model uses satellite imagery (spatially distributed, visible, near-infrared, and thermal infrared data) that includes the albedo (solar reflection coefficient), leaf area index, vegetation index, and surface temperature. This complex algorithm calculates evapotranspiration on a pixel-by-pixel basis to determine the optimum amount of water needed to sustain healthy plant life in any part of the world. It can also calculate the biomass production (total plant life) in a specified area and soil moisture in the root zone.
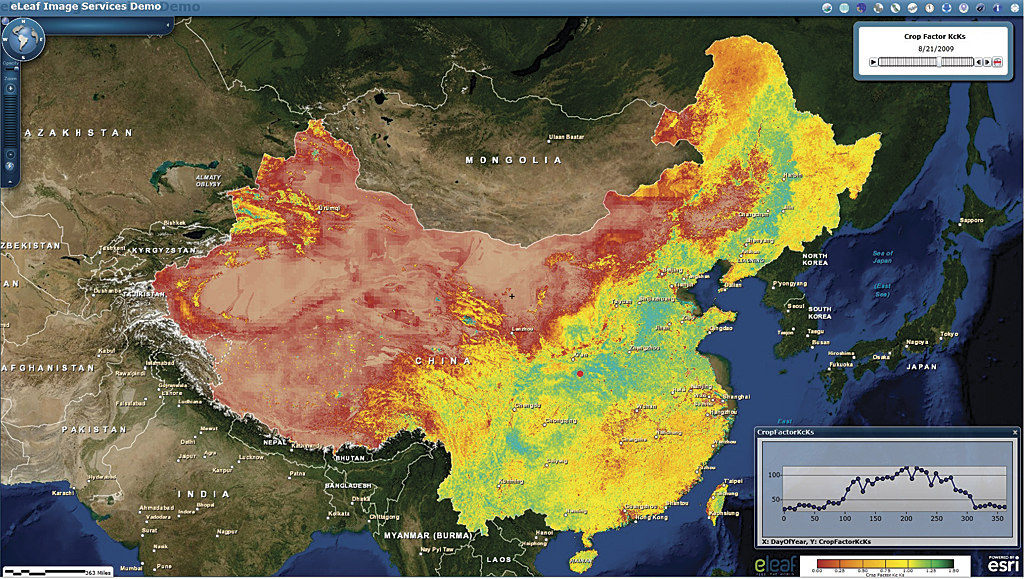
Bastiaanssen established WaterWatch to pursue his research in water resource modeling and remote sensing. The framework WaterWatch developed for PiMapping is based on the SEBAL model. Along with supporting algorithms, PiMapping provides essential meteorologic input data such as wind speed, humidity, solar radiation, and air temperature. Combining those inputs with remote-sensing data, PiMapping generates weekly updates on biomass production, water productivity, crop water requirements, root-zone soil moisture, and CO2 intake.
PiMapping Moves to ArcGIS
eLEAF is working with Esri’s Professional Services team to port PiMapping’s complex tools to a standardized ArcGIS platform. “The solution will leverage Esri’s cloud infrastructure, opening many new exciting opportunities for data analysis and dissemination,” said Bastiaanssen.
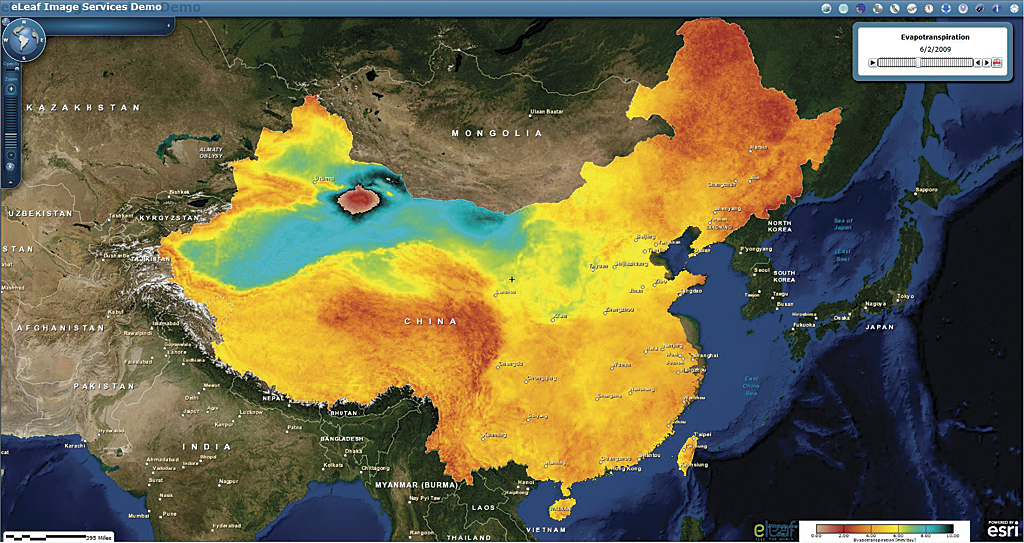
Time-series data collected from this framework is plotted in ArcGIS to create evapotranspiration and biomass production maps. Benefits are substantial and include the estimation of water requirements for different agro-ecosystems, drought monitoring, the identification of areas for possible water savings, and the potential volume of such savings. “Compelling visualizations of our results are essential to get the message across,” Bastiaanssen explained. “In our day-to-day consulting work, we have seen substantial productivity increases thanks to the great mapmaking features of Esri’s products.”
Because they are GIS based, evapotranspiration maps can also be combined with land-use and biomass coverages. Combining these maps provides a great deal more information, such as the amount of water use by land-use class; the boundaries of areas where water consumption can, and cannot, be controlled; the impact of changes in land use on downstream water availability; crop water productivity; and the amount of water that can be saved while the same production levels are maintained.
“From our analyses, you can determine how much water is available in a specified area, what yield you can expect from the water that is available for your crops, and how efficiently water is used. This will enable farmers to produce more food in a sustainable way,” said Voogt.
ArcGIS in Cloud Delivers eLEAF Data
ArcGIS hosted in the Amazon cloud delivers eLEAF data to clients. “We are in the process of creating a worldwide database from our analyses that anyone can access using very simple web services,” said Ad Bastiaansen, cofounder of eLEAF. “ArcGIS has the features we need to integrate with our clients’ systems.”
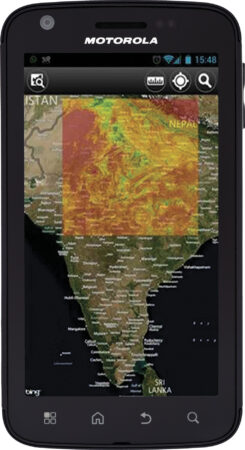
Once data is processed and quality checked, it is posted in eLEAF’s data warehouse. ArcGIS for Server exposes the data in multiple formats, such as Open Geospatial Consortium, Inc. (OGC), web services, and through an image server so eLEAF can feed websites, as well as smartphone applications, that accommodate customer demands. To afford easy access to its global databases, eLEAF also provides its service via ArcGIS Online. “ArcGIS Online is a wonderful platform. People can experience our products and easily integrate them in their maps,” added Bastiaansen.
The rollout of eLEAF’s ArcGIS Online service has begun in South Africa. As new data is acquired, the service will expand to the entire African continent, then to the Middle East. Updates are applied to previously collected data on a weekly basis so users’ decisions are based on current data.
“Initial reports from South Africa indicate that the eLEAF service has been well received by agronomists, particularly because of its portability to the field,” Bastiaansen said. “We are happy that our efforts will help local farmers increase their productivity.”
About the author