Standardizing data formats for habitat and species data

Editor’s Note: The European Topic Centre on Biological Diversity (ETC/BD) is an international consortium that assists with the European Environment Agency (EEA) in reporting on Europe’s environment, provides information that aids development of sustainable policies, and builds infrastructure for carrying on these tasks. The ETC/BD had a tool developed and delivered in an ArcGIS Python toolbox that helps member states convert locally available data about distribution of species and habitat types into a standard format for analysis and sharing.
During the last decades, the European Union (EU) and European Environmental Agency (EEA) have led the struggle to conserve Europe’s natural environment through extensive funding and by establishing a uniform practice in the field for all member states.
The Habitats Directive and the Birds Directive are among the most important legislation addressing the problem of nature conservation. These documents instituted the Natura2000 network of protected sites, which seeks the preservation of habitats and species of community importance for future generations.
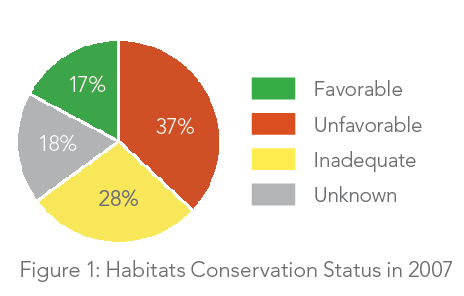
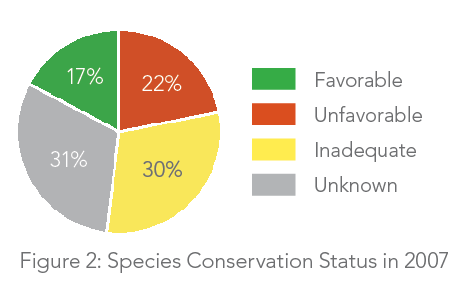
The Habitats Directive’s objective is to ensure that all the species and habitats of community interest, which are listed in its annexes, will be maintained at or restored to favorable conservation status. Article 17 of the Habitats Directive established a requirement that reports on the implementation of the Directive be prepared by the member states and be sent to the European Commission. A similar provision is found in Article 12 of the Birds Directive. These reports, submitted every six years, must provide extensive data regarding the conservation status of species and habitats that are favorable, inadequate, unfavorable, or unknown. In the 2007 report, only 17 percent of the assessments of species and habitats were assessed as favorable. For a significant percentage of species and habitats, data was insufficient to assess the conservation status.
Among the provided data, of primary importance is the geographic distribution and range of the species or habitat types, which is (naturally) in a GIS format. While most member states have collected data on habitats and species of community importance, the data is inconsistent. Different member states have opted for different means of representing this data. Some states maintain precise observations of particular species or habitats, while others have identified contiguous areas where a certain habitat type occurs. Other states have data based on a national grid system,and still others have data in a variety of forms. In 2007, the 25 EU member states provided approximately 16,000 maps that used 32 projections.
It is crucial that this data be harmonized and aggregated across member states so it can be adequately analyzed and the conservation status of species and habitats assessed at the European biogeographic level. Consequently, the EEA and ETC/BD wanted to provide national organizations in all 27 member states with tools to create standardized outputs that could be used for the June 2013 reports.
The actual task of developing a tool for this spatial data was awarded by ETC/BD to TeamNet International, Romania. Because ArcGIS for Desktop has been adopted on such a large scale by national environmental agencies and environmental organizations, it was decided that the tool should be delivered in the form of a Python-based toolbox. The tool, publicly available on the EEA website, provides compatibility with ArcGIS for Desktop from versions 9.3.1 to 10.1.
Known as RangeTool, this tool helps member states convert locally available data about the occurrence or observation of species and habitat types into a standard format. Besides providing a consistent format, the tool also computes the range for the selected species or habitat types. Both outputs are based on a user-chosen grid system (either national or Europe-wide). Both are represented as merged cells of the original reference grid that was provided as input.
While RangeTool generates distribution data by simply combining the different data provided by the member states and matching it with the grid cells, a more complex approach is needed for calculating the range. A natural range is determined by ecological conditions. It can be discontinuous and have gaps. Incomplete observational data also contains gaps. During the previous Article 17 reporting period, each member state designed its own algorithm for calculating range. As a result, the quality of reported ranges was uneven.
RangeTool generates grid-based ranges for species and habitats in an automatic and consistent way. It uses as input a grid-based map of distribution derived from locations of confirmed sightings or occurrences. In addition to existing distribution data, the tool requires information about the correlation between certain species or habitat types and biogeographic regions. Such data is provided in tabular form and GIS format by the ETC/BD.
RangeTool leverages both formats to adjust the generated ranges to existing biogeographic regions. Consequently, the range will extend only over those biogeographic regions for which species or habitats were reported as present. It also provides a method for excluding from the range locations and areas where certain species or habitat types cannot extend such as a large body of water for terrestrial species or habitats or large urban or industrial areas. The tool can generate a single range for species split across multiple files, even when geometries differ.

RangeTool also offers quality control for input data. It uses the tabular data about the correlation between species, habitats, and biogeographic regions. The tool can inform the user about the lack of presence in an expected biogeographic region, or conversely, the presence in an unsuitable biogeographic region. Optionally, the RangeTool quality control can also make use of the data reported by member states regarding the occurrence of particular species or habitats in Natura2000 sites (along with the geographic extent of the sites). In this case, the tool also notifies users about the lack of occurrence or observations data about species and habitat types in the sites in which the species or habitat have been reported but where no distribution data was provided.
Conclusion
RangeTool helps EU member states harmonize available spatial data about species and habitat types of community importance so they can submit standard reports in June 2013, making the assessment of the conservation status for European biogeographic regions easier and more accurate. RangeTool can be downloaded from the European Topic Centre on Biological Diversity website.
Get more details about the 2007 assessment of the conservation status.

About the authors

Lurie Maxim

Daniel Morath