A food security project in Madagascar used predictive analysis tools for optimizing the siting of food distribution locations to minimize the distances women and children had to travel to receive aid.
In its 2015 Global Hunger Index, the International Food Policy Research Institute assigned Madagascar and six other developing countries, alarming, the worst classification that year. With 80 percent of Madagascar’s rural population deemed poor or extremely poor by the World Bank, this is not surprising. Though the country’s economy is agriculturally based, production levels are low due to a lack of agricultural inputs such as fertilizers. This is one of the reasons the country is a net importer of rice, which is a dietary staple and also its primary crop.
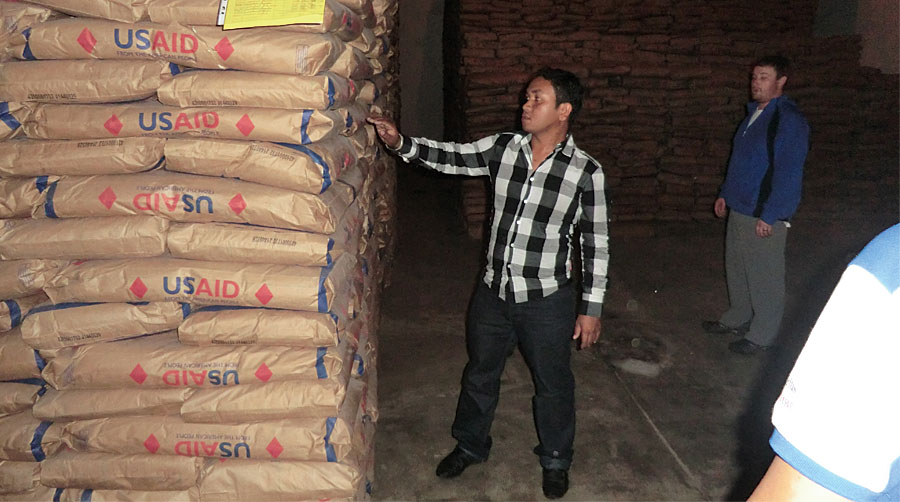
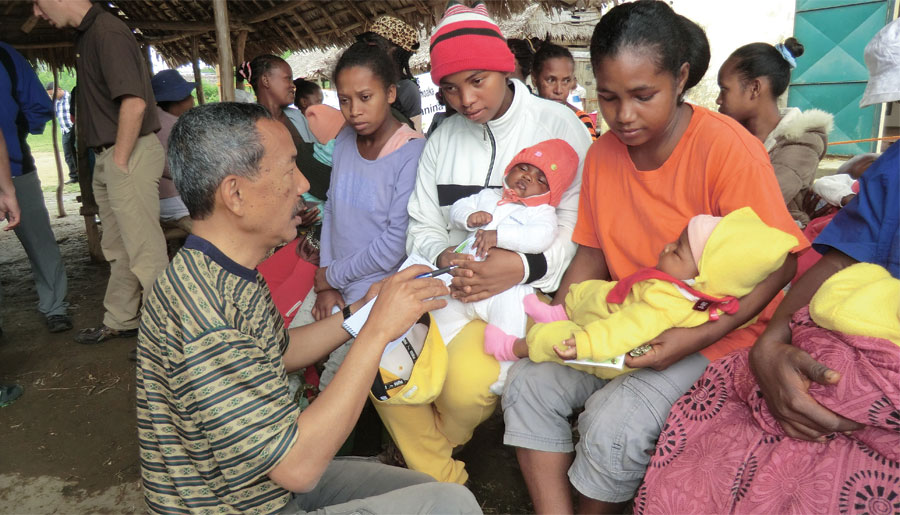
The United States Agency for International Development (USAID) Office of Food for Peace announced in 2014 a new food security project for Madagascar. The project is called Fararano, which means harvest season in Malagasy, the local language. Fararano follows the nutritional guidelines developed by 1,000 Days, an international nonprofit coalition of nearly 100 government and private agencies. This organization is dedicated to providing wholesome food for new and expectant mothers and their young children during the first 1,000 days of life. Nutrition during the first 1,000 days of an infant’s life is critical for mental and physical development. In Madagascar, a significant number of infants and young children are stunted owing to insufficient nutrition.

Catholic Relief Services (CRS) Madagascar worked with local partners to develop the distribution network necessary to deliver food commodities to women and children. The Fararano project was established in three rural regions in Madagascar where lack of food security is a particular problem. The program directly benefits approximately 364,000 people in the lean season (women, children in their first 1,000 days, and their households) by providing food supplementation on a monthly basis. People in these areas often live many kilometers from paved roads. To obtain nutrition supplements, program recipients must walk to distribution sites that are only open for a few hours each month when the CRS teams make scheduled deliveries.
Since program participants are pregnant women or women carrying small children, it was important to optimize site locations to minimize travel distances. To accomplish this, CRS teams collected the GPS coordinates for the location of each participant’s home. The site selection process considered the distance that participants would have to walk to their food distribution location and the presence of a road that could accommodate the six-ton trucks used to provision the distribution site. Sites also needed a source of potable water, adequate storage for food, shelter, toilets, and security for participants. In general, participants who live in the same group of villages (known as a fokontany) are encouraged to collect food allotments from the same distribution center on the same day each month.
CRS Madagascar worked with implementing partners in the regions that participate in the Fararano project. These are mainly local charity organizations that assist by warehousing foodstuffs and providing vehicles and drivers for food deliveries. In addition, CRS coordinated with each fokontany’s care group and village development committee to recommend distribution center locations for women living in rural regions who participate in the program.
Shortly after the program began, only about 75 percent of those eligible to participate were collecting their food allotment on their distribution days. Follow-up interviews revealed that participants had to cross rivers four to six times when traveling to distribution center locations. In this wet climate, flooding could prevent women from crossing rivers and reaching distribution sites on the appointed days. Washed-out roads or bridges sometimes made it impossible for trucks to make deliveries on time.
The distance to distribution sites also lowered participation rates. If food was not collected, the CRS program incurred additional costs associated with returning the food to storage. These disruptions in the supply chain made planning difficult.
“We recognized this was a geography problem and decided to apply geospatial analysis to help optimize the site selection for new food distribution locations to make the project more successful,” said Daniel Andriantsimba, Regional Solutions architect and GIS specialist for CRS. This process included identifying better routes for delivery trucks traveling to the distribution sites and increasing the efficiency of all logistical operations. Instead of determining distribution sites based solely on the average walking times of beneficiaries, new locations were based on an optimal walking distance that was no more than 5 kilometers (3 miles) for most participants.
“In addition, we wanted to develop a versatile predictive model that could be adapted to our other local projects such as water, sanitation, and hygiene programs. We also wanted to use it for the management and monitoring of various activities and facilities such as home visits and sanitation infrastructure, value chains and market access programs, food for work projects, and disaster preparedness,” said Andriantsimba.
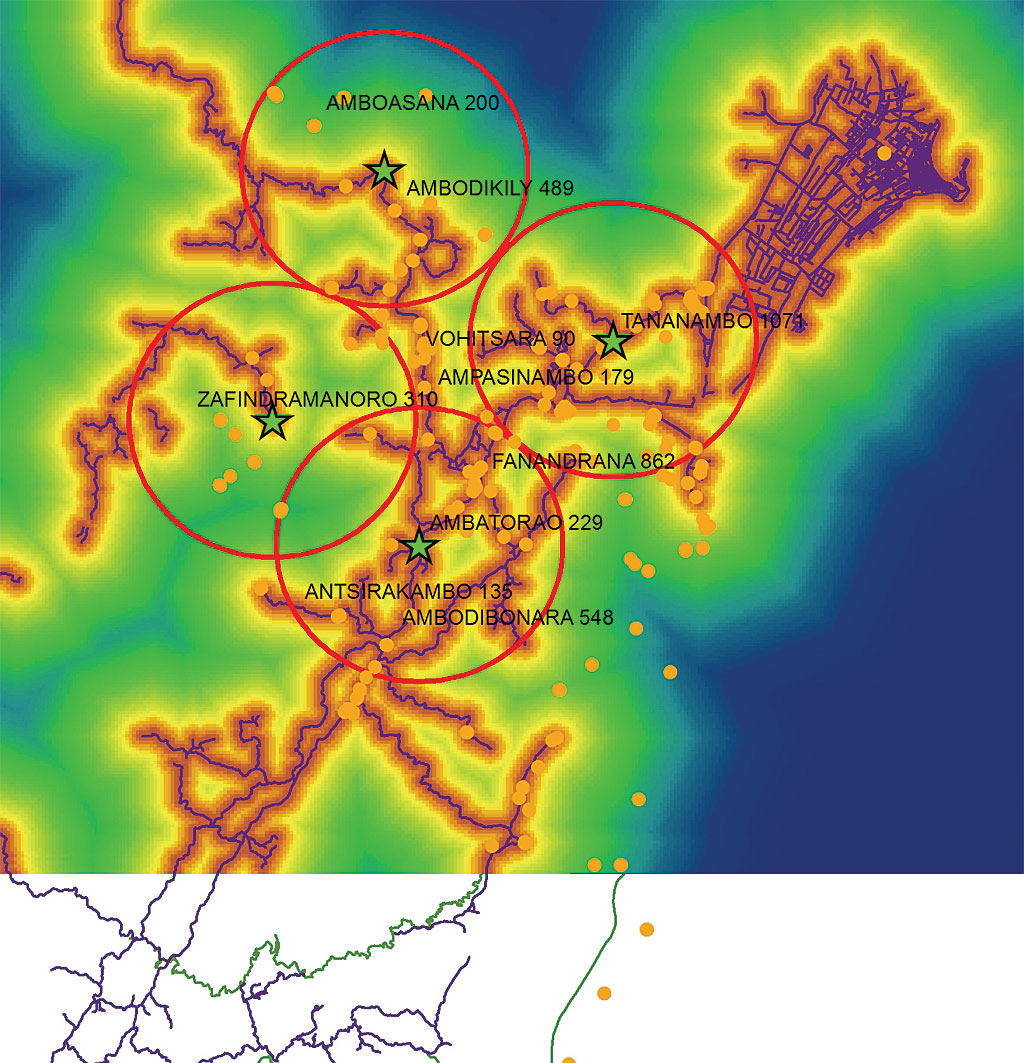
CRS worked with Esri Professional Services to develop the algorithm and methodology for its predictive analysis model used to improve the food distribution locations for the Fararano project. Initially, beneficiaries’ homes were located on a topographical map and a circle with a 5-kilometer radius was drawn that encompassed the greatest number of participants. Participants who lived outside the 5-kilometer boundary were counted.
The ArcGIS Predictive Analysis Add-In was used to refine the predicted walking times for each distribution site. This add-in provides a set of tools for building models for predicting the location of moving or stationary targets or events.
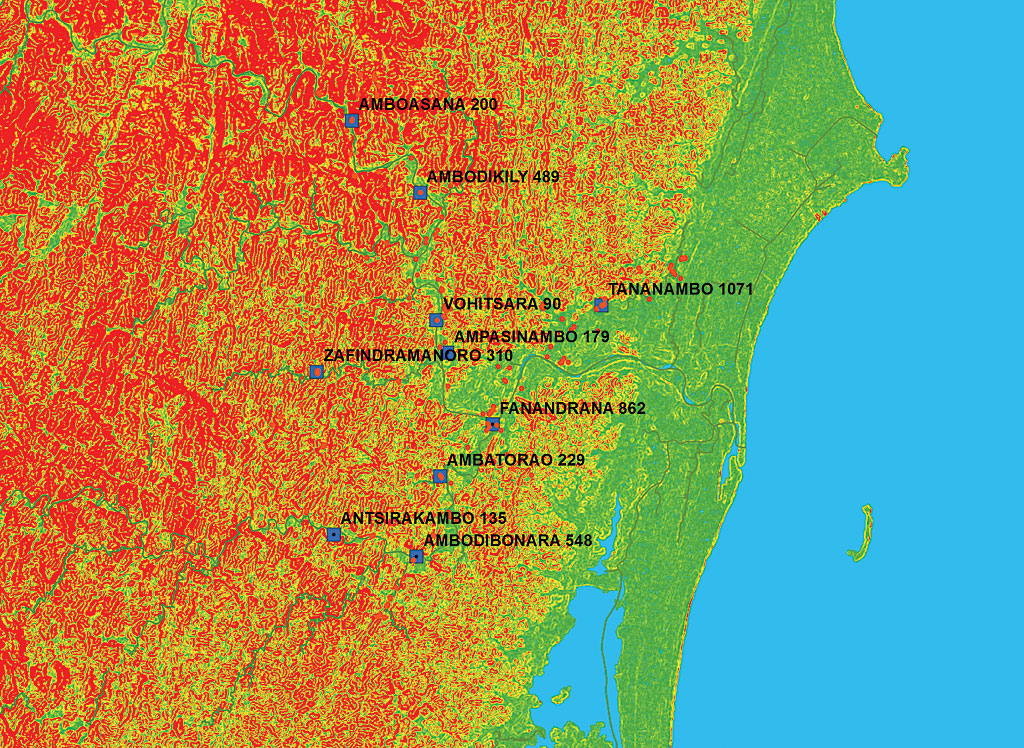
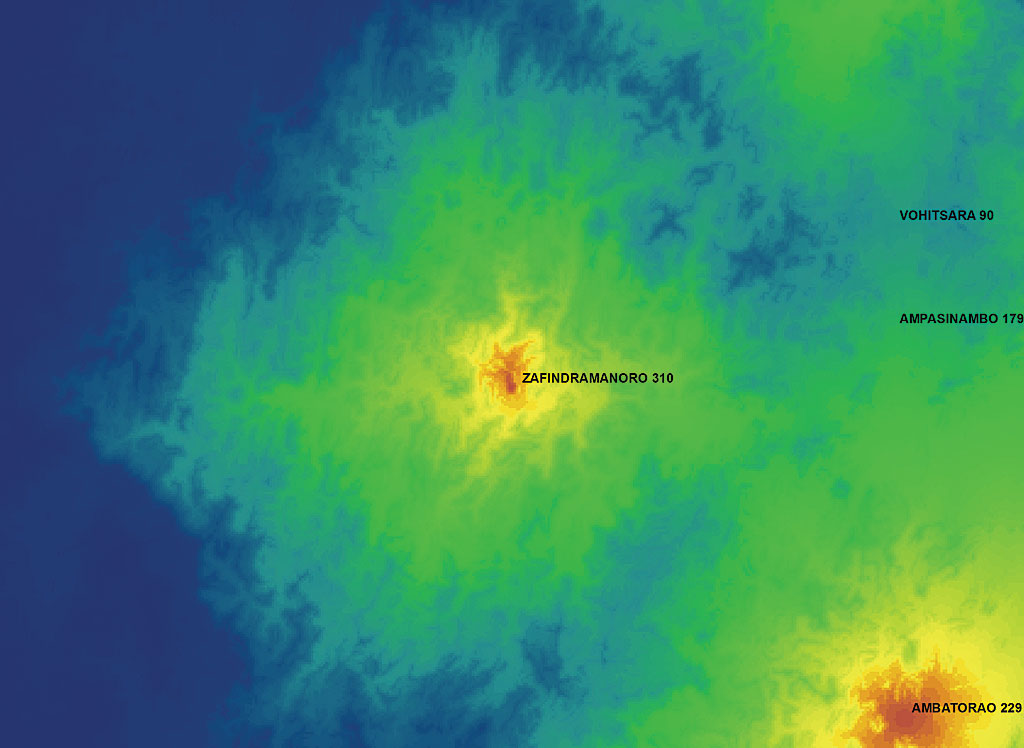
A 30-meter digital elevation model (DEM) of Madagascar was processed to generate a slope layer. This layer showed how flat or steep the terrain was between each village and distribution site. The Distance From tool in the Predictive Analysis Add-In used the DEM to produce a raster that codes the distance to the nearest potential distribution sites.
Next, the Speed Model Builder, a tool in the ArcGIS Predictive Analysis Add-In, used the slope layer and the raster produced by the Distance From tool to develop a SpeedModel raster that took into consideration multiple environmental variables such as the slope of the terrain, existing roads, and the locations where rivers can be crossed.
Naismith’s Rule was applied at this point. Originally devised in 1892 by Scottish mountaineer William W. Naismith, it is a rule of thumb for calculating the time required to walk a distance that modifies time estimates based on the steepness of the terrain. This rule was adjusted to take into account the fact that Madagascar women, who were often carrying children, were unlikely to use routes that included steep terrain or required them to ford streams.
The SpeedModel raster was used as input for the Time From tool to create a time-of-travel layer. Using these terrain-derived layers, the Route Finder tool was used to evaluate the distance and travel time for program beneficiaries for various scenarios. This let CRS evaluate different potential distribution site locations by using the most likely paths beneficiaries would take to avoid steep terrain and hazards.
By running the model many times on potential distribution sites, CRS predicted travel times for all participants in each region. With this information, CRS could add new food distribution sites and replace some existing ones to minimize walking time for most participants. As a result, many women spent less time traveling to distribution sites. Even those who lived outside the 5-kilometer boundary had total travel times of less than four hours.
CRS adapted this approach for its Food for Work (FFW) program. Using the same organizational structure and predictive analysis model used to plan and implement the Fararano project for the FFW program saved time and improved the performance of workers involved in the project. The cost calculation algorithm CRS developed that was based on geographic awareness was used to evaluate the program and improve outcomes.
“Due to the implementation of predictive analysis to select optimal food distribution sites, some of the most problematic locations achieved a 20 percent increase in consistent attendance, from 75 percent to 95 percent and a significant decrease in average walk times,” said Mike Ruth, Esri project manager. “This means that pregnant mothers and children are significantly more likely to have consistent access to nutrition that they need to overcome malnutrition. And the families do not have to spend so many valuable hours of their day walking to and from the distribution sites.”
About the author

