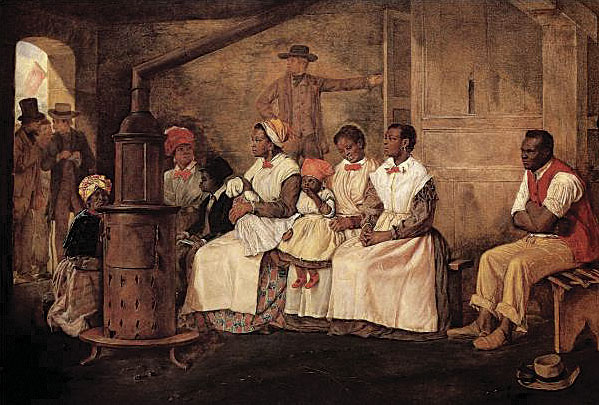
Eyre Crowe, an English painter who was accompanying British novelist William Thackeray on a lecture tour of the United States, arrived in Richmond, Virginia, in March 1853. On Crowe’s first full day in the city, he set out for an area of the city called Shockoe Bottom to witness several slave auctions, hoping to find “a possibly dramatic subject for pictorial illustration.” Crowe recorded what he saw in his powerful painting Slaves Waiting for Sale.
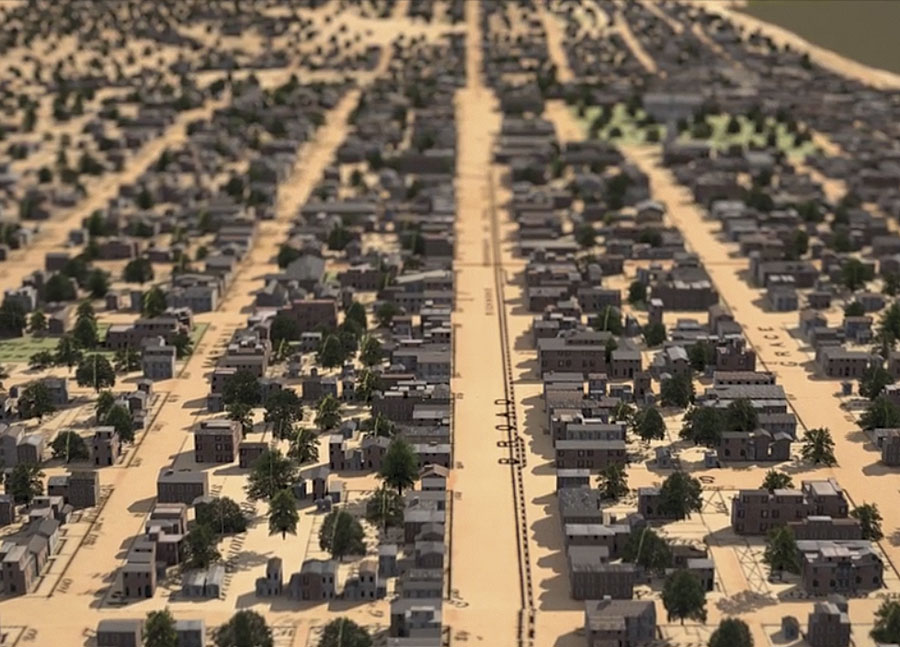
Fast-forward more than 150 years. Many people are still seeking a greater understanding of the subject of Crowe’s painting, the slave trade. Most of the sites where people were bought and sold in Richmond have been obscured by development. The Digital Scholarship Lab (DSL) at the University of Richmond has reconstructed this historic landscape in a 3D visualization for an exhibit at the Library of Virginia, “To Be Sold—Virginia and the American Slave Trade,” that was on display from October 2014 to May 2015.
The goal of building the 3D visualization was to help visitors envision Crowe’s journey through Richmond and experience the slave trade through his paintings and engravings. This was a challenge for a number of reasons. One was the lack of evidence of the built environment of the city in the early 1850s. Building footprints—the foundation of any urban 3D model—were nonexistent for that time period. DSL opted to use an 1876 map by F. W. Beers that showed buildings, parks, and other features in great detail.
To minimize the problems with using an 1876 map to represent Richmond in 1853, DSL georeferenced other maps of Richmond from the 1850s using the Georeferencing toolbar in ArcMap. With this combination of maps, DSL digitized more than 3,000 building footprints in ArcMap that were based on the F. W. Beers map. DSL staff, with help from Dr. Maurie McInnis, the curator of the exhibit and author of a recent study of the visual and material culture of the American slave trade, gathered numerous photos of buildings and detailed descriptions of the materials and architectural styles of the city during the 1850s.
Accurately modeling thousands of buildings to portray antebellum Richmond was no small task. DSL student interns started modeling buildings by hand, using photographs and footprints exported from ArcMap into Google SketchUp. These buildings were highly detailed, but it took more than four months to produce 30 buildings.
With over 3,000 buildings left to model and a majority of them lacking pictorial evidence, the project was off to a slow start. The only information for most of these buildings was the general building materials used and the architectural styles employed.
“Esri CityEngine solved an enormous problem for us,” said Nathaniel Ayers, the visualization and web designer at the DSL. CityEngine perfectly met the challenge of modeling a large-scale 3D urban environment. Its procedural modeling approach enabled DSL to generate a large number of buildings that were true to the architectural style of historic Richmond. Using a set of rules based on information such as building height, window spacing, and facade textures, the procedural content was generated in a matter of seconds versus the months it would have taken with a traditional hand-modeling approach.
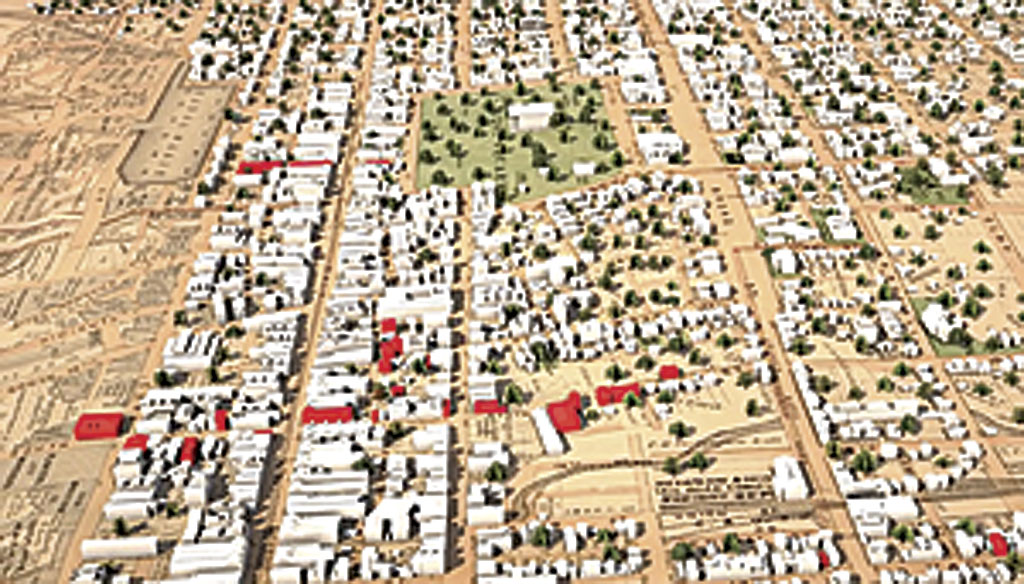
Since CityEngine uses shapefiles as input, uploading the building footprints was seamless. Tree point locations were also uploaded, and Esri’s 3D Vegetation Library was used to generate trees for the model. The generated buildings and trees were exported as an OBJ file. The file was imported into 3D Studio Max 2013 for final rendering and animation to give the model consistency, since different software products were used to model buildings.
The project drew from multiple 3D modeling software applications. ArcMap was used for creating the building footprints for the model. CityEngine generated the bulk of the buildings. Using a combination of modeling approaches allowed DSL to capture the architectural details of a specific time and place and apply these styles over dozens of square blocks of a city. This gives viewers a real sense of what the city was like during this time. Using CityEngine’s procedural modeling approach, along with more traditional modeling styles, resulted in a stunning visualization of what Richmond might have been like when Crowe experienced the slave trade and created his striking paintings and engravings.
See a video of this project. For more information, contact Justin Madron, GIS analyst at the University of Richmond’s Digital Scholarship Lab.